Farm Progress' Joshua Baethge reported at the end of last week that "it’s hard to find anyone optimistic about passing a new farm bill this year. While the two political…
Farm Safety-Net Payments Through the First Three Years of the 2014 Farm Bill, CRS Report
Background
Earlier this month, the Congressional Research Service (CRS) released a report titled, “Farm Safety-Net Payments Under the 2014 Farm Bill: Comparison by Program Crop,” which stated in part that, “The 2014 farm bill (Agricultural Act of 2014, P.L. 113-79) authorizes farm safety-net programs for the five crop years of 2014 through 2018. This includes revenue support for 20 ‘covered commodities’ under either the Agricultural Risk Coverage (ARC) program or the Price Loss Coverage (PLC) program and interim financing and floor price support for an expanded list of 24 ‘loan commodities’ under the Marketing Assistance Loan (MAL) program. Outlays under the MAL, ARC, and PLC programs are funded by the U.S. Department of Agriculture’s (USDA’s) Commodity Credit Corporation (CCC).
“In addition, federally subsidized crop insurance is available for over 100 agricultural commodities—including both covered and loan commodities. Federal crop insurance is permanently authorized by the Federal Crop Insurance Act (7 U.S.C. 1501 et seq.) but is periodically modified by new farm bill legislation. The principal subsidy component of federal crop insurance is premium subsidies that pay for an average of 62% of the cost of buying an insurance policy since 2014. Premium subsidies are funded by USDA’s Federal Crop Insurance Corporation (FCIC).
“Through the first three years of the 2014 farm bill (2014 through 2016), USDA has spent over $38 billion on commodity-specific farm program outlays. Annually, commodity-specific outlays are estimated at $12.7 billion per year, including $7.5 billion for CCC programs and $5.2 billion in FCIC crop insurance premium subsidies. When farm program payments are linked to specific crops, they can influence relative market incentives and resource allocations. Furthermore, significant differences in spending across program crops may have regional or geographic implications.”
Today’s update focuses on several highlights of the CRS report.
Looking Forward, versus Actual Spending
This month’s CRS report also explained that, “In their June 2017 baseline projections of USDA program outlays through 2027, the Congressional Budget Office (CBO) projects disparities in payments and relative support levels across program crops. CBO’s June projections are described in a lay-friendly study released by farmdocdaily on July 14, 2017. In the farmdocdaily study, when combined farm safety-net payments (excluding federal crop insurance premium subsidies) are expressed on a per-acre basis, peanuts receive the highest support rate with an average of $288 per acre. Rice receives the second-highest per-acre rate at $135 per acre. The average annual payment rate for all other program crops is below $30 per acre.
“The CBO projections are looking forward in years yet to come. In contrast, this report uses actual historical data to construct a series of charts and tables that provide information on the distribution of commodity-specific outlays under the farm safety-net programs of the 2014 farm bill during its first three years of operation (2014 through 2016).”
Farm Safety Net Spending- Highlights
The CRS report explained that, “USDA commodity programs operate counter-cyclically to commodity prices: Payments increase when commodity prices fall below support levels and decline when prices rise. In contrast, federal crop insurance outlays are pro-cyclical to commodity prices: Liability, premiums, and federal support outlays increase or decrease with commodity prices. As a result of their opposing cyclical behavior, CCC and FCIC outlays tend to counter-balance each other.
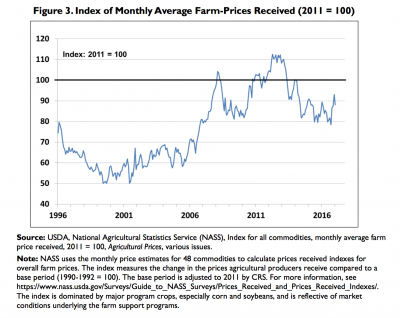
“Between 2006 through 2013, CCC-funded program outlays declined while FCIC support for crop insurance expanded. This shift was primarily the result of market conditions and the associated rise in commodity prices that occurred during that same period rather than a change in policy. Since 2014, farm prices have again turned downward and CCC outlays have increased relative to FCIC outlays.”
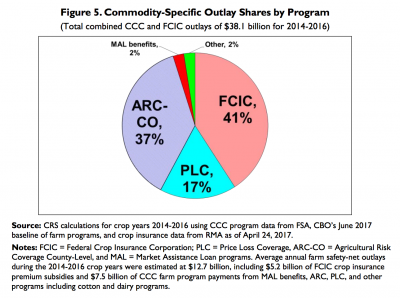
The report also pointed out that, “CCC programs accounted for 59% of commodity-specific outlays, with FCIC outlays accounting for the balance of 41%.
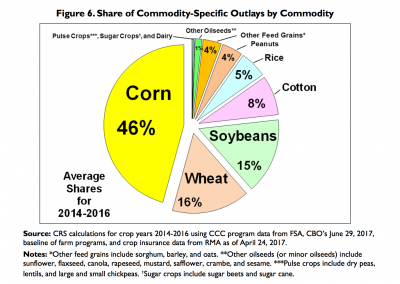
In a closer look at commodity specific outlays, the CRS report indicated that, “Most of the commodity-specific costs for the farm safety net under the 2014 farm bill may be attributed to a few major crops. Corn (46%), wheat (16%), soybeans (15%), cotton (8%), rice (5%), and peanuts (4%) cumulatively account for 94% of CCC and FCIC payments from 2014 through 2016. Although these six crops receive a majority of farm program support, they do not constitute a majority of farm output value: During 2014 to 2016, these crops have accounted for about 28% of total farm receipts including fruits and vegetables, livestock, dairy, and poultry. It is this preponderance of CCC and FCIC spending focused on a small number of commodities that merits further inspection of how the programs function across program crops.”
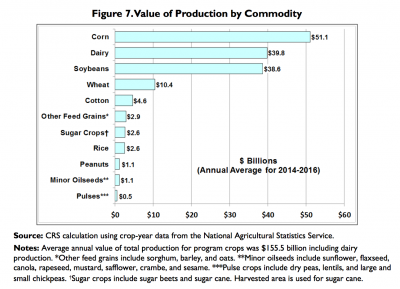
The CRS report added that, “Corn is the largest crop grown in the United States both in terms of planted acres (Figure 9- below) and value of output (Figure 7- below). During 2014-2016, the three largest crops in value terms—corn, dairy, and soybeans—accounted for about 34% of the total value of U.S. agricultural output.”
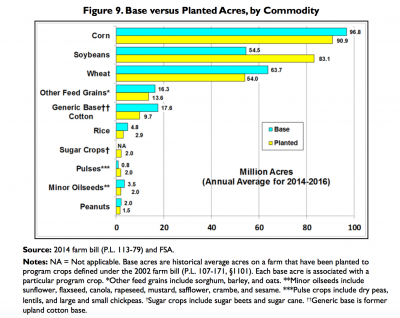
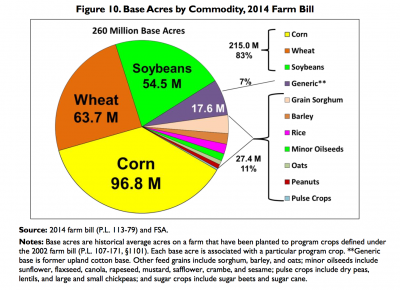
“Since the allocation of commodity-specific payments is based largely on historical or current output, base acres and current planted acres are major factors in understanding the distribution of payments. For example, corn is the largest crop grown in the United States in terms of both planted acres and base acres (Figure 9- above).
Thus, corn has the most acres potentially eligible for MAL benefits and ARC or PLC payments.
This month’s update also pointed out that, “Under the 2014 farm bill, there are 260 million base acres eligible for payment under the ARC or PLC programs. The three largest crops—corn, soybeans, and wheat—account for 83% of total base acres. This compares with their combined 74% share of acres planted to principal crops in the United States over the same period.”
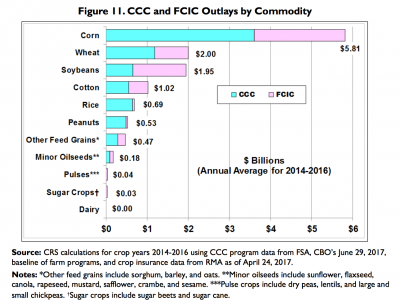
With respect to absolute payment levels, CRS stated that, “Under this commodity structure, corn producers have received an average of $5.81 billion per year under the 2014 farm bill (Figure 11- below). This compares with $2 billion per year for wheat and soybeans, respectively. Corn support represents 46% of annual CCC and FCIC commodity- specific payments (Figure 6-above). The absolute size of corn’s federal farm support payments is largely determined by its extensive planted and base acres (Figure 9- above).”
Note that the CRS report also examined: Payments per-acre and as a share of value of production, payments as a share of cost of production; and, also looked at support levels compared to market prices, among other issues.
Near the conclusion of the report, CRS stated that, “There may be little or no practical or theoretical justification for equalizing support rates, total payments, or payments per harvested acre. In fact, some critics say the subsidies themselves are not justified. However, to the extent that farm support is a key part of congressional debate, support levels among crops are likely to be a consideration. Large disparities in the relative levels of protection among program commodities can influence resource allocations and cropping decisions, potentially resulting in unintended market consequences that may have regional implications.”


