The U.S. Courts report that 315 farm bankruptcies were filed in calendar year 2025, up 46% from 2024. While still down from recent highs, this is the second year in…
2018 Purdue University Outlook: Cash Rents, Farmland Values, Corn and Soybean Prices
The Agricultural Economics Department at Purdue University recently released its annual outlook report that contained 12 specific articles looking at various aspects of the U.S. agricultural economy. This post highlights key points from the Purdue report relating to cash rents, farmland values, and the price outlook for corn and soybeans.
Cash Rents
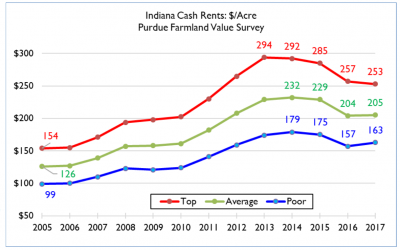
Professor Craig Dobbins indicated that, “In order to maintain a viable business, operators have been working to reduce the per bushel cost of production. Reducing cash rents and other crop production cost is often a slow process. The outlook for crop costs and returns indicates operators have been working to lower per bushel production cost since 2013.
In 2013, the variable cost per bushel of corn on average quality farmland was $2.83. The projection of for 2018 indicates the variable cost per bushel has declined to $2.39 per bushel. This is about a 16% reduction.
“Reductions to cash rent have also occurred. In 2013, cash rent per bushel of corn was $1.43. For 2018, our projected per bushel cash rent is $1.13, a reduction of 21% from 2013.”
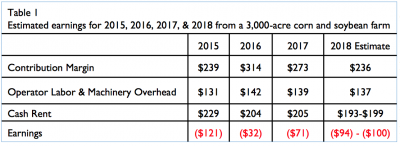
The update explained that, “Table 1 provides estimates of the earnings for a 3,000-acre corn and soybeans farm.”

With respect to the specifics contained in Table 1, the report explained that, “The contribution margin is total gross revenues less variable costs. This margin is the amount of gross revenue remaining to pay the resources of operator labor, machinery, and land or cash rent. The cost estimates for these resources indicate an estimate of the payment required to keep these resources in their current use. The negative earnings indicate there is not enough income to compensate these resources at the estimated cost. It also indicates continued pressure to lower per bushel production costs or increase revenue. The larger negative values for 2018, indicates this pressure is increasing rather than declining.”
Dr. Dobbins noted that, “Given the economic pressures at this time, 2018 cash rent is expected to be lower. Periods of declining cash rent are historically rare. The better than expected yields for many producers in 2017 will provide support for stable cash rents, but continued low crop prices indicate producers need to continue all efforts to reduce costs.
Anticipated cash rents in 2018 will be 3% to 6% lower than in 2017.
“Even with this reduction which is already built into numbers in Table 1, estimated earnings associated with rented land will be more negative than in 2017.”

The Purdue discussion on cash rents also pointed out that, “Using futures markets to look beyond 2018, the market anticipates corn prices will move towards $4.00 while soybean prices will remain flat. These price movements will generate more revenue for a corn and soybean rotation, but at current production cost, earnings continue to be strongly negative. In other words, looking for ways to reduce the cost of production will need to continue.”
Farmland Values
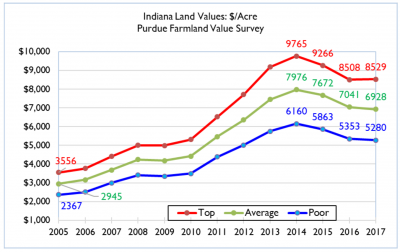
Dr. Dobbins also penned the Purdue analysis on farmland values, which stated that, “As Indiana farmers move into 2018, higher than expected 2017 yields surprised many producers, but grain prices remain at low levels. While there have been some downward adjustments in the cost of inputs, input prices have been slow to reflect the lower grain prices. With abundant corn harvests of 2016 and 2017 corn stocks have been rising. Barring an unexpected supply disruption in 2018, it seems unlikely corn and soybean prices will be significantly higher.”

The update noted that, “While the decline in income generated by farmland is a strong negative influence on farmland values, other factors influence farmland values. Low long-run interest rates continue to be supportive but the Fed has begun to raise interest rates. As these higher rates spread through the economy, this will create resistance to higher farmland values.”
Looking ahead, the Purdue outlook indicated that, “Some state surveys are finding small increases in farmland values [e.g., Iowa], perhaps indicating the downward adjustment is slowing or even ending. The 2017 Purdue Land Value Survey indicated a bit of stabilization in farmland values but there were still significant reductions in areas of the state.
The continued tight margins in crop farming combined with slowly rising long-term interest rates is expected to favor a continuation of the downward price movement. For 2018, it seems Indiana farmland values are likely to decline another 5% to 10% from 2017 levels.
Corn Prices
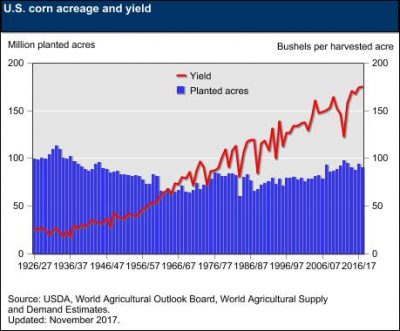
Professor Chris Hurt stated in the Purdue update that, “National corn yields were at record high levels of 175.4 bushels per acre according to USDA. U.S. corn yields have set new records in three of the past four years.”

“Even though corn acreage was down in 2017, the record yields mean that the U.S. produced more corn than will be consumed with ending stocks rising to near 2.4 billion bushels. Unfortunately, ending stocks for the 2017/18 marketing year will rise for the fifth consecutive year.
As a result, marketing year average prices are expected to be the lowest in 11 years dating back to the 2006 crop.
The update added that, “With the large inventories, it will be difficult for corn usage to rise enough to generate strong price rallies. Rather it is recommended that producers keep their rally objectives moderate. Corn prices this winter may find a trading range of about 25 to 35 cents per bushel….The dismal current corn prices and anticipation of poor returns to corn in 2018 will likely begin to shift some acreage out of corn around the globe. As a result, corn prices may begin to improve for the 2018-2019-2020 crops. At this point, it appears that 2017 corn prices may well be the lowest marketing year average for the 14 crop years from 2007 to 2020.”
Soybean Prices
In his analysis of soybean prices, Dr. Hurt noted that, “While corn prices are buried under large inventories, soybeans are in better shape. Increased purchases this marketing year from China, or reduced yields in South America could both provide soybean price recovery. The current LA Nina weather pattern is expected to continue through the winter and into spring. LA Nina’s have a tendency to cause dry weather in Argentina and that is now the case. Argentina is the third largest soybean exporter, but the largest exporter of meal and oil products. Reduced production there would stimulate U.S. soybean and product exports.”
While #soybean exports from the U.S. have grown over past 25 yrs, the share of U.S. exports in global oilseeds trade has declined--- growth of foreign soybean output and exports, #Brazil & #Argentina https://t.co/QDYZneStrm @USDA_ERS pic.twitter.com/Z2uHbX4aFx
— Farm Policy (@FarmPolicy) December 2, 2017
The Purdue update also pointed out that, “New crop soybean prices once again seem to suggest that market prices are bidding for more soybean acres and less corn and wheat. Somewhat higher U.S. acreage in soybeans in 2018 will moderate price recovery for 2018 crop beans. Nevertheless, even with this anticipation, futures markets are suggesting 2018 soybean prices will be $.30 to $.40 higher than the 2017 crop.”


