Bloomberg's Leah Nylen reported Thursday that "a Colorado judge issued an order temporarily blocking the proposed $25 billion merger of Kroger Co. and Albertsons Cos., which has been challenged by…
Recent USDA-ERS Reports: Farm Structure (2017), and Evolving Distribution of Government Farm Payments (1991-2015)
The U.S. Department of Agriculture’s Economic Research Service (ERS) has recently released two separate reports that provide interesting perspective on the structure of U.S. agriculture. The first provides a detailed overview of current statistics relating to U.S. farms, while the second highlights the evolving distribution of Federal farm payments (1991-2015). This update underscores key findings from the two recent ERS reports.
Farm Structure- “America’s Diverse Family Farms, 2017 Edition”
On Friday, ERS released a report titled, “America’s Diverse Family Farms, 2017 Edition,” which provided “an overview of U.S. farms, including the latest statistics on production, financial performance, and farm household characteristics by farm size categories.”
The report explained that,
Family farms of various types together accounted for 98.8 percent of farms and 90 percent of production in 2016.
“Large-scale family farms accounted for the largest share of production, at 45 percent.”
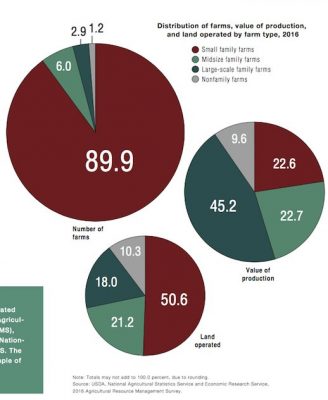
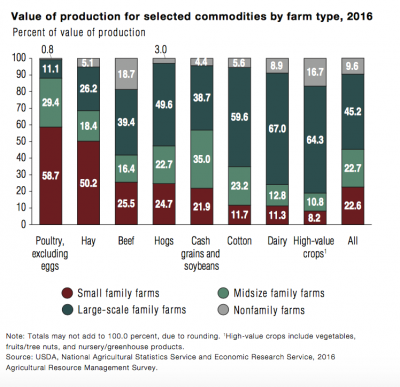
The ERS report noted that, “Large-scale family farms account for half of hog production and two-thirds of both dairy production and high-value crops like fruits and vegetables.”
With respect to crops, the report explained that, “Midsize and large-scale family farms dominate cotton (83 percent of production) and cash grains/soybeans (74 percent).”
While discussing the average age of U.S. farmers, Friday’s update stated that, “Thirty-six percent of principal farm operators were at least 65 years old in 2016, compared with only 14 percent of self-employed workers in nonagricultural businesses.”
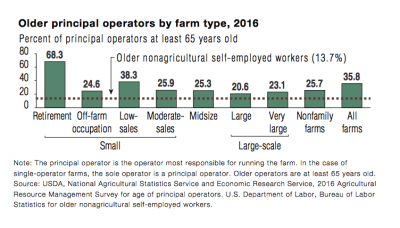
However, the report added that,
The advanced age of farm operators is understandable, given that the farm is the home for most farmers and farmers can phase out of farming gradually by renting out or selling parcels of their land.
“Operators on retirement farms rented out 31 percent of their land in 2016 and enrolled another 14 percent in the USDA Conservation Reserve Program (CRP).”
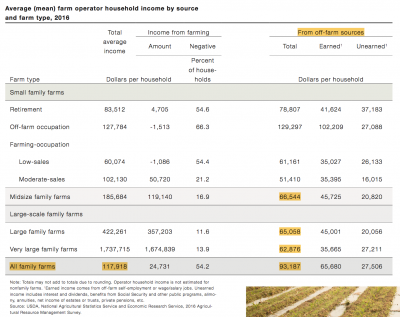
In a closer look at Farm Operator Household Income, ERS noted that, “Self-employment or wage/salary jobs are the main source of off-farm income for farm households. Farm households often use off-farm income to cover farm expenses and fund their farm operations.”
The following table, which detailed the significance of off-farm income, was also included in the ERS report.
While discussing government payments, the ERS report stated that, “Commodity program payments are targeted at production of specific commodities and reflect acreage in crops historically eligible for support.”
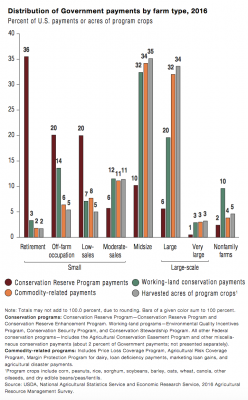
“Seventy-seven percent of these payments went to moderate-sales, midsize, and large family farms in 2016, roughly proportional to their 80-percent share of acres in program crops.”
Similarly, ERS noted that, “Indemnities from Federal crop insurance are roughly proportional to acres of harvested cropland.”

“Midsize and large family farms together received 66 percent of indemnities while accounting for 61 percent of harvested cropland in 2016.”
Distribution of Government Farm Payments
Meanwhile, on November 30th, ERS released a report by Jonathan McFadden and Robert Hoppe titled, “The Evolving Distribution of Payments from Commodity, Conservation, and Federal Crop Insurance Programs.”
McFadden and Hoppe indicated that, “In this report, we examine the level and distribution of payments to farmers, through commodity, conservation, and crop insurance programs, and track changes in the distribution over time. In particular, we track trends in the distribution of payments and crop insurance indemnities by farm household income.”
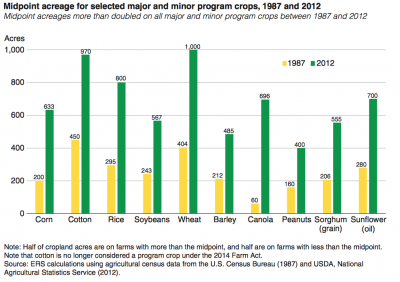
With respect to changes in farm size, ERS noted that, “In particular, Census of Agriculture data are used to report midpoint acreages in 1987 and 2012 for 10 different field crops. Midpoints more than doubled on each of the 10 crops during this period.”
The report noted that, “Commodity program payments have shifted to higher income households over time, although year- to-year changes in the overall farm economy can move the distribution around its trend. In 1991, the 50th percentile value of household income was $60,717 (2015 dollars): half of commodity payments went to farms operated by households with incomes at or above $60,717, and half went to households earning no more than that value. The 75th percentile value was $127,818 (25 percent of payments went to households earning more than that income), and the 90th percentile income was $257,530 (10 percent of payments went to higher income households).”
“In 2013, the 50th percentile income was $207,417—more than three times the value in 1991, while the 75th percentile was $504,984, and the 90th percentile was $1,077,879.”

After additional analysis, the ERS report included the following chart depicting, “Farm household income at the 50th percentile for Government payments—by type of program— and Federal crop insurance, 1991 and 1996-2015.”
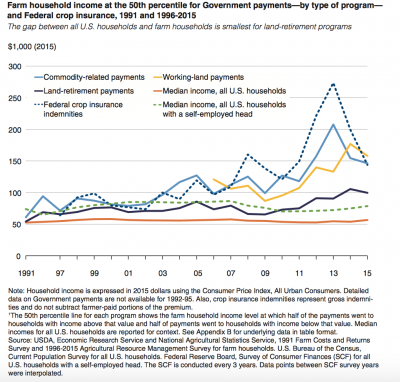
The ERS report succinctly stated that, “Changes in the structure of agriculture have changed the distribution of income support over time. Specifically, commodity program payments, some conservation program payments, and Federal crop insurance indemnities have shifted to larger farms as U.S. agricultural production continues to consolidate. Since the operators of larger farms have higher household incomes than those of smaller farms, commodity program payments and support through Federal crop insurance have also shifted to higher income households.”


