Bloomberg's Leah Nylen reported Thursday that "a Colorado judge issued an order temporarily blocking the proposed $25 billion merger of Kroger Co. and Albertsons Cos., which has been challenged by…
USDA-ERS Report: Farmland Values, 2000-2016
Today’s update looks briefly at farmland values in the United States, with a specific focus on a recent report from USDA’s Economic Research Service (ERS) that examined farmland values from 2000 to 2016. The ERS report noted that, “The value of farm real estate accounts for over 80 percent of the value of farm-sector assets and is an important indicator of the sector.”
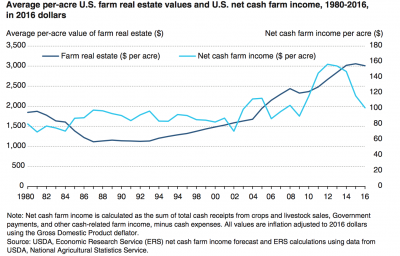
On Wednesday, ERS released a report (“Farmland Values, Land Ownership, and Returns to Farmland, 200-2016,” by Christopher Burns, Nigel Key, Sarah Tulman, Allison Borchers, and Jeremy Weber) which stated that, “Economic theory suggests that farmland values will change in response to changes in the underlying factors that support them, namely, returns to farmland. One measure of returns to farmland is net cash farm income per acre, or the net return that an acre of farmland generates.”
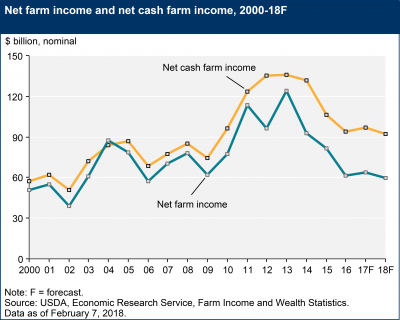
Net cash farm income has dropped 36 percent since its peak in 2012
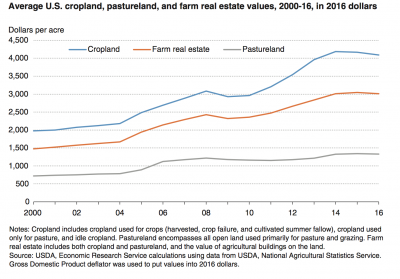
“Values for both cropland and pastureland, two major uses for farmland, increased substantially in 2004-14, nearly doubling in real, or inflation-adjusted, terms.”
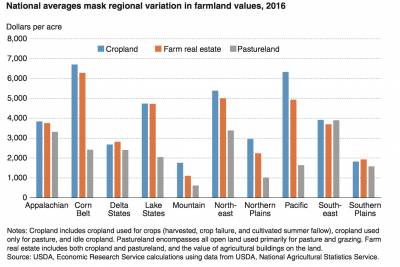
Wednesday’s report noted, “But national trends in U.S. cropland and pastureland values can disguise regional variation in land values, which can result from differences in soil quality, annual rainfall, and proximity of urban areas, among other factors.”
In 2016, the most valuable land was cropland in the Corn Belt, at an average of $6,710 per acre.
More specifically on regional differences in farmland values, the ERS authors explained, “In 2003-08, cropland appreciated almost uniformly across the regions. However, in 2009-14, cropland appreciation was mostly concentrated in four regions: the Northern Plains, Corn Belt, Lake States, and Delta States. This was largely due to increases in commodity prices for grain and oilseed crops.”
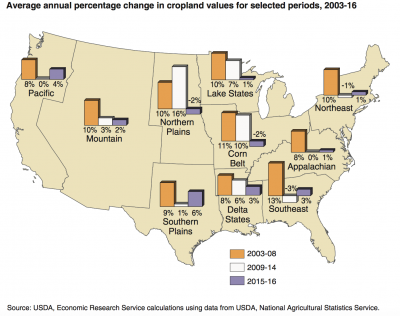
More recently, the report indicated that, “In 2015 and 2016, net cash farm income fell from its 2013 peak. The primary factors driving lower net cash farm income are lower commodity prices and lower cash receipts. As expectations for future net cash farm income have been adjusted downward, land value appreciation has moderated and even declined. The Northern Plains and Corn Belt, which had high levels of cropland value appreciation in 2009-14, had low to negative growth from 2015 to 2016, reflecting the drop in cash grain and oilseed prices.”
In a closer look at farmland returns, last week’s report stated, “If farmland prices are supported by current farmland returns and interest rates, the capitalized value—or price-to-value (PTV) ratio—should be around 1.0. A PTV ratio higher than 1.0 suggests that current income does not support land values.”
“The PTV ratio hit an all-time low of about 0.5 in 2012, driven by large cash returns to farmland caused by high commodity prices. However, with the drop in net cash farm income between 2014 and 2016, the ratio has climbed back toward 1.0.”
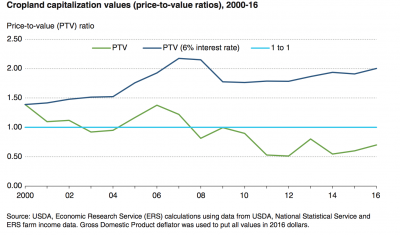
The ERS authors pointed out that, “The importance of interest rates to cropland values can also be seen using this measure. If 10-year Treasury note rates are fixed at the 2000 level (6 percent), the cropland PTV ratios stay above 1.0 in 2000-2016.
This indicates that current returns would not have supported farmland values during this period without falling interest rates. As a result, future increases in interest rates could lead to a decline in farmland values.
The ERS report also discussed issues associated with cash rents and pointed out that, “As with farmland values, cash rents for cropland vary considerably depending on the region…[I]n 2016, the most expensive region was the Pacific, at $245 per acre per year; the least expensive was the Southern Plains, at $37 per acre. Cash rents changed dramatically in certain regions in 2000-2016. Cash rents in the Lake States, Northern Plains, and Corn Belt increased the most during this period. In fact, cash rents in the Corn Belt increased 52 percent (in inflation-adjusted dollars) from 2004 to 2014.”
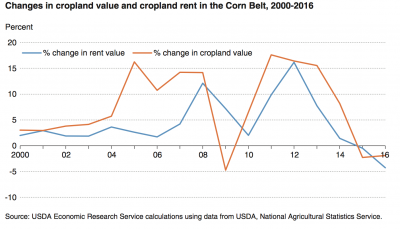
The report added that, “Evidence of cash rental value declines lagging behind declines in operator returns also has been documented in Illinois and elsewhere, suggesting that if farmland values decline, cash rents will adjust downward more slowly, potentially adding more financial stress to farms that cash rent large portions of their operated acres. Similarly, upward adjustments in cash rents will lag behind land value increases.”
After a closer examination of the effect of changing land values on farm household wealth, borrowing, land ownership, and farm size; and a look at the potential impacts of government policy on future farmland values, the ERS report stated that, “Future trends in farmland values will depend on net cash returns to farmland, interest rates, and agricultural policy.
A small increase in interest rates is likely to cause farmland values to decline by increasing borrowing costs and increasing the opportunity cost of alternative investments, all else equal.
“The Agricultural Act of 2014 eliminated fixed Direct Payments and expanded crop and pastureland insurance programs. Evidence from the academic literature suggests that insurance payments will be capitalized into land values by reducing volatility in net returns.”


