The U.S. Courts report that 315 farm bankruptcies were filed in calendar year 2025, up 46% from 2024. While still down from recent highs, this is the second year in…
Agricultural Economy: Land Values, Value of Production, and Number of Farms
Today’s update looks briefly at recent publications from the Federal Reserve Bank of Minneapolis, and the USDA’s National Agricultural Statistics Service. These reports give additional insight into the state of the U.S. agricultural economy by providing information on agricultural credit conditions and land values, the value of agricultural production, and the number of farms in the U.S.
Federal Reserve Bank of Minneapolis- Ag Credit Survey
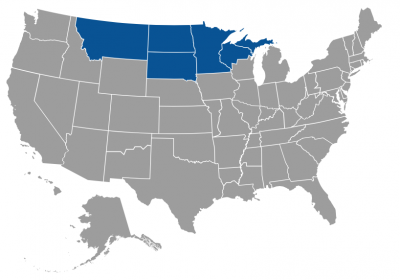
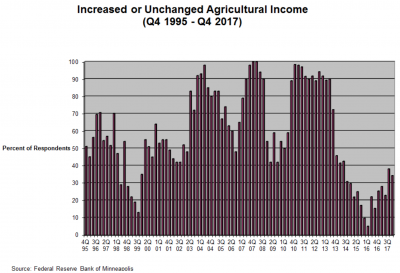
Last week, the Federal Reserve Bank of Minneapolis released its Fourth-Quarter 2017 Agricultural Credit Conditions Survey. Authored by Joe Mahon, a regional outreach director at the Fed, the report stated that, “Farmers in most areas of the Ninth District saw good yields in 2017, and for another year those strong harvests partly offset the effect of low crop prices. Farm incomes and capital spending continued to decrease, according to lenders responding to the Minneapolis Fed’s fourth-quarter (January) agricultural credit conditions survey.
Falling incomes also led to decreased loan repayment rates, while loan demand, renewals and extensions increased. Farmland values continued to decline, albeit at a slower pace, while cash rents were more stable.
“The outlook for the first quarter of 2018 is meager, with survey respondents predicting a further decline in incomes and capital spending.”

The Fed update noted that, “Two-thirds of lenders said that farm income decreased in the fourth quarter compared with a year earlier, while only 7 percent reported increases. While 15 percent of North Dakota lenders reported increased income, the highest proportion in any district state, more than half said incomes decreased. A greater share of lenders, 79 percent, said capital spending by agricultural producers fell in the fourth quarter, and another 20 percent reported that it was flat. Farm household spending was also down, with 46 percent of respondents reporting decreases and half indicating it was unchanged.”

With respect to interest rates, the survey pointed out that, “Fixed interest rates on loans for operating, machinery and real-estate each increased by more than 10 basis points on average from their third-quarter levels, according to respondents; variable rates also increased slightly.”
In a closer look at land values and cash rents, the Minneapolis Fed survey indicated that, “Cropland values continued to decrease somewhat in the final three months of 2017, though the pace of decline slowed compared with recent surveys. Meanwhile, cash rents increased slightly.
Nonirrigated farmland values fell by an average of 1 percent across the district compared with a year earlier, while cash rents for that land increased 0.8 over 2017.
“Irrigated farmland values were roughly unchanged on average, and rents increased slightly. Lenders in North Dakota reported the biggest drop in land values, with nonirrigated land down 3.6 percent and irrigated land down 6 percent. The picture for ranchland was the reverse of that for cropland—values increased 3.5 percent, but rents fell 2.4 percent.”
USDA- NASS: Crop Values 2017 Summary (Corn, Soybeans)
Also last week, USDA’s National Agricultural Statistics Service (NASS) released its Crop Values 2017 Summary.
With respect to corn and soybeans prices, the report indicated that, the price of corn in the U.S. fell the past three years from $3.61 in 2015, to $3.36 in 2016, to $3.30 in 2017.
The U.S. soybean price in 2015 was $8.95, went up to $9.47 in 2016, but fell back to $9.30 in 2017.
The value of the U.S. corn crop varied in a fairly narrow range the past three years, going from $49.3 billion in 2015, up to $51.3 billion in 2016, and $48.5 billion last year.

On the hand, the value of U.S. soybean production has increased recently, going from $35.2 billion in 2015, to $40.7 billion in 2016, and $41.0 billion last year.
USDA- NASS: Farms and Land in Farms, 2017
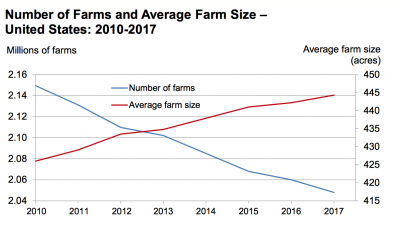
In mid February, NASS released its Farms and Land in Farms 2017 Summary, which stated that, “The number of farms in the United States for 2017 is estimated at 2.05 million, down 12 thousand farms from 2016. Total land in farms, at 910 million acres, decreased 1 million acres from 2016. The average farm size for 2017 is 444 acres, up 2 acres from the previous year.”

More specifically, the NASS update noted that, “The number of farms in Sales Classes $100,000 – $249,999 and $1,000,000 or more increased while all other sales classes declined. Fifty percent of all farms had less than $10,000 in sales.
Eighty percent of all farms had less than $100,000 in sales. Eight percent of all farms had sales of $500,000 or more.

With respect to land in farms, the NASS report noted that, “The biggest change for 2017 is that producers in Sales Class $1,000,000 or more operated 1.3 million more acres than in 2016. Similar to the previous year, in 2017 over 30 percent of all farmland was operated by farms with less than $100,000 in sales. Forty-one percent of all farmland was operated by farms with sales of $500,000 or more.”


