Farm Progress' Joshua Baethge reported at the end of last week that "it’s hard to find anyone optimistic about passing a new farm bill this year. While the two political…
As Farm Bill Stalls Over SNAP, USDA-ERS Report Captures Details of the Program
An article at Politico on Thursday indicated that bipartisan negotiations over the Farm Bill had stalled due to issues surrounding the nutrition title of the new measure. More specifically, the Politico article stated that, “Democrats are revolting to potential changes to the Supplemental Nutrition Assistance Program, or SNAP, still commonly known as food stamps.” Also on Thursday, USDA’s Economic Research Service (ERS) released a detailed annual report that explored fiscal year 2017 federal data related to USDA nutrition programs, including SNAP. Today’s update looks at this ERS report in more detail, and also touches briefly on a SNAP related report released last week by the Center on Budget and Policy Priorities.
Farm Bill- SNAP Issues Hold Up Progress
Last week, a FarmPolicyNews update pointed out that the nutrition title of the Farm Bill had become a snag in progress toward the release of the draft measure. On Thursday, Politico writers Liz Crampton and Helena Bottemiller Evich reported that, “Bipartisan negotiations over the farm bill stopped Thursday afternoon after House Agriculture Committee ranking member Collin Peterson faced pressure from fellow Democrats who complained that discussions about changes to the food stamp program were being kept secret.”
Crampton and Evich added that, “A letter signed by 19 Democrats on the committee states that they ‘have grown increasingly concerned about the nutrition policies being pushed by the majority. Items you have broadly outlined in your meetings with us and that have been reported in the press are a significant cause of concern.'”
Chairman @ConawayTX11 was just handed this letter by House Ag Dems urging him to show them the farm bill text. pic.twitter.com/QYJIh4obzA
— Teaganne Finn (@Teaganne_Finn) March 15, 2018
Disappointed to see my Dem Colleagues on @HouseAgNews playing politics with Farm & Food Policy. These obstructionist tactics mean less certainty for farmers & no new investment in job training for SNAP recipients. https://t.co/kyh3J7UYxg
— Rep. Vicky Hartzler (@RepHartzler) March 17, 2018
USDA-ERS Annual Report on Trends in U.S. Nutrition Assistance Programs- SNAP
With this background on the current Farm Bill in mind, on Thursday, USDA’s Economic Research Service (ERS) released an annual report (“The Food Assistance Landscape: FY 2017 Annual Report,” by Victor Oliveira) which uses preliminary data from USDA’s Food and Nutrition Service to examine trends in U.S. food and nutrition assistance programs through fiscal 2017.
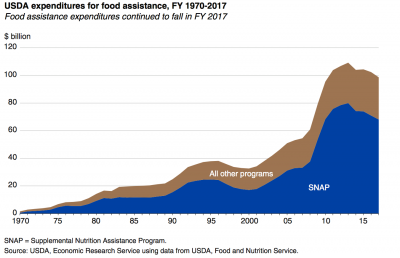
The report explained that, “Spending for USDA’s 15 domestic food and nutrition assistance programs totaled $98.6 billion in FY 2017, 4 percent less than in the previous fiscal year and almost 10 percent less than the historical high of $109.2 billion set in FY 2013.”
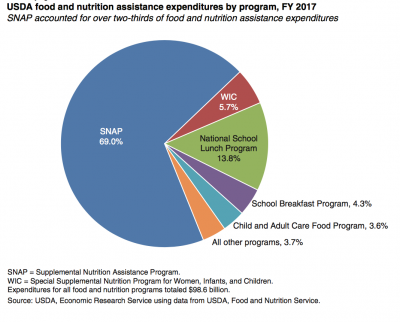
“The Supplemental Nutrition Assistance Program (SNAP) accounted for 69 percent of all Federal food and nutrition assistance spending in FY 2017. On average, 42.2 million persons per month participated in the program, almost 5 percent fewer than in the previous fiscal year.
Reflecting the decrease in participation, Federal spending for SNAP totaled $68.0 billion, or 4 percent less than in the previous fiscal year. This was also 15 percent less than the historical high of $79.9 billion set in FY 2013.
The ERS report explained that, “The [SNAP] program provides monthly benefits for participants to purchase food items at authorized retail foodstores. SNAP benefits can be redeemed for most types of food but cannot be used to purchase tobacco, alcohol, hot foods, or foods intended to be eaten in the store (except by people who cannot cook for themselves). Unlike other food and nutrition assistance programs that target specific groups, SNAP is available to most needy households with limited income and assets (subject to certain work and immigration status requirements).”
“During FY 2017:
- FY 2017 marked the fourth consecutive year that participation decreased after increasing in 12 of the previous 13 years
- About 13 percent of the Nation’s population participated in the program in an average month.
- Per-person benefits averaged $125.99 per month, about the same as in the previous fiscal year.”
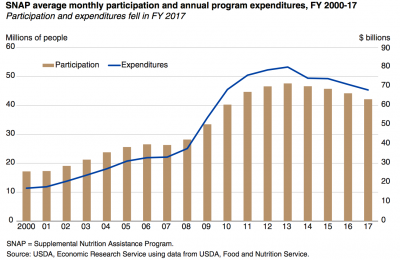
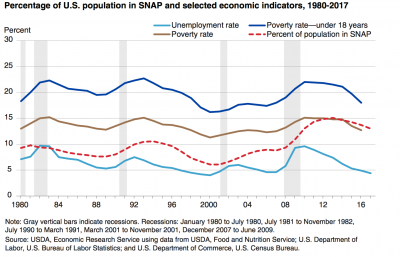
Last week’s report also noted that, “SNAP is one of the Nation’s primary countercyclical programs, expanding during economic downturns and contracting during periods of economic growth. The share of the population in SNAP generally tracks the poverty rate and— to lesser degrees—the unemployment rate and the poverty rate for children under age 18. However, the improvement in economic conditions during the early stage of recovery may take longer to be felt by lower educated, lower wage workers who are more likely to receive SNAP benefits, resulting in a lagged response of SNAP participation to a reduction in the unemployment rate.”
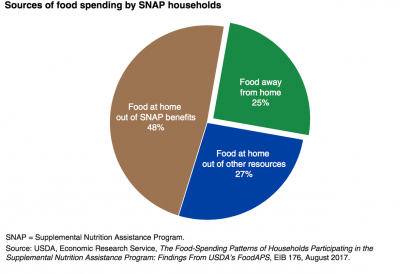
The ERS report indicated that, “The contribution of SNAP benefits to household food spending is substantial, almost two-thirds (63 percent) of food-at-home spending.
This demonstrates that SNAP benefits make a substantial contribution to the food spending of participant households, but that these households also use other resources (such as their own income or other cash assistance benefits) to pay for food.
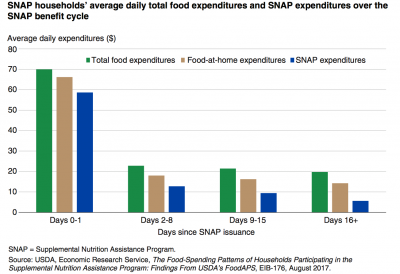
In addition, the ERS nutrition report added that, “SNAP benefits account for most (89 percent) daily average expenditures on food at home on the day of and the day following benefit receipt. In the days following, the share of food-at-home spending attributed to SNAP declines, though with day-to-day variation. By the second half of the month (days 16 and beyond), spending out of SNAP bene ts accounts for 40 percent of average daily food- at-home spending.”
Center on Budget and Policy Priorities Report
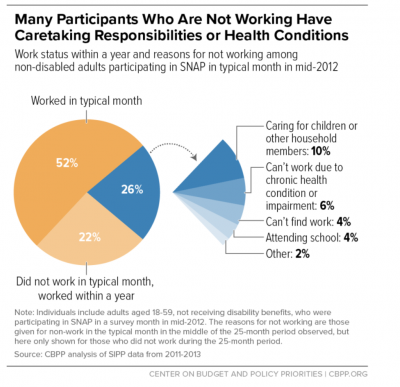
Also on Thursday, the Center on Budget and Policy Priorities (CBPP) released a paper (“Most Working-Age SNAP Participants Work, But Often in Unstable Jobs,” by Brynne Keith-Jennings and Raheem Chaudhry) which stated that, “While most participants work in a given month while they receive SNAP, even more work within a year. Among non-disabled adults participating in SNAP in a particular month in mid-2012, 52 percent worked in that month, but about 74 percent worked at some point in the year before or after that month (a period of 25 months). Rates were even higher counting work among other household members: over 80 percent of SNAP households with a non-disabled adult, and 87 percent of households with children and a non-disabled adult, worked in this 25-month period. The increased work rate over time demonstrates that joblessness is often a temporary condition for SNAP participants.”
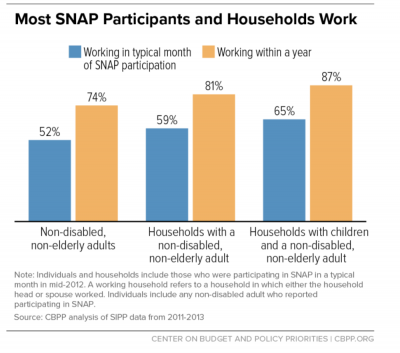
The CBPP report added that, “Many SNAP participants who did not work over the 25-month period reported caregiving responsibilities or faced barriers to work. The adults who did not work over the 25-month period surrounding the given month in 2012 when they participated in SNAP most commonly reported caregiving responsibilities (for children or others), health conditions that prevent work, inability to find work, or going to school as the reason for not working.”
