A bipartisan group of former leaders of America's major agricultural commodity associations and biofuels organizations, farmer leaders, and former senior USDA officials sent congressional ag leaders a letter on Tuesday…
ERS Report– Federal Risk Management Tools for Agricultural Producers: An Overview
Last week, the U.S. Department of Agriculture’s Economic Research Service (ERS) released a timely report regarding farm policy titled, “Federal Risk Management Tools for Agricultural Producers: An Overview.” Today’s post recaps highlights from the ERS report.
The report, which was authored by Mesbah Motamed, Ashley Hungerford, Stephanie Rosch, Erik O’Donoghue, Matthew MacLachlan, Gregory Astill, Jerry Cessna, and Joseph Cooper, stated that, “A variety of risk management programs are available to help crop and livestock producers mitigate losses to their income due to yield and price risk.
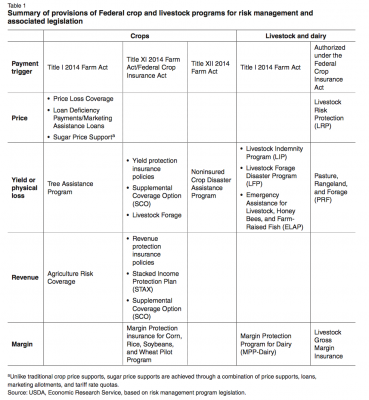
“Table 1 [below] presents a summary of selected commodity support programs organized by commodity type, legislative statute, and payment triggers.”
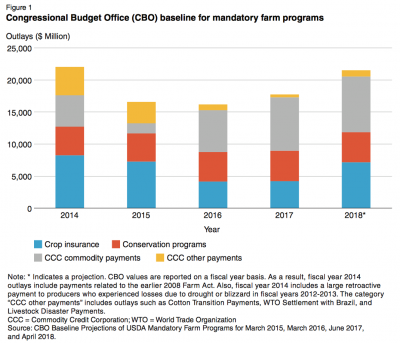
With respect to spending on these programs, the report indicated that, “Figure 1 shows the Congressional Budget Office’s (CBO) actual and projected spending on mandatory farm programs, including the items that appear in table 1, namely, crop insurance, crop commodity support programs under Title I of the Agricultural Act of 2014, and other payments to farmers.”
The authors reminded readers that, “Title I of the 2014 Farm Act repealed the Direct Payments (DP), Countercyclical Payments (CCP), and Average Crop Revenue Election (ACRE) programs. The Act also removed upland cotton from the list of covered crops. In their place, Title I established two new programs: Price Loss Coverage (PLC) and Agriculture Risk Coverage (ARC).”
Beyond Title I programs, the report explained that, “In addition to price and revenue support programs, the Federal Government offers a variety of insurance and disaster assistance programs to agricultural producers. A summary of these programs appears in table 4 [below].
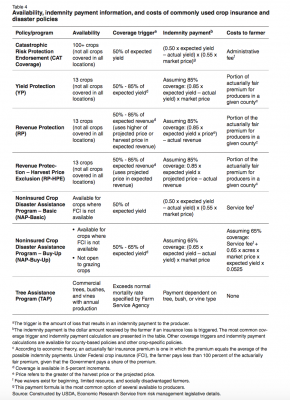
“Producers and policymakers have moved increasingly toward risk management programs, such as insurance with subsidized premiums and insurance-like buy-up provisions for the Noninsured Crop Disaster Assistance Program (NAP), created for non-insurable commodities.
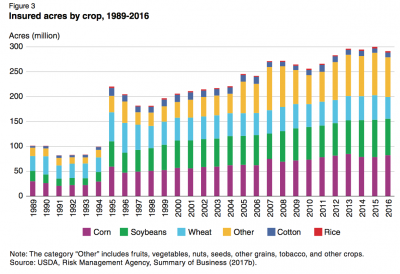
In 2016, the Risk Management Agency (RMA) of the USDA covered nearly 300 million acres and over $100 billion in liabilities. These costs account for around $7.9 billion out of the USDA’s $164 billion budget for fiscal year (FY) 2017.
More specially on crop insurance, ERS noted that, “Between 1989 and 2016, the U.S. crop insurance program increased its coverage and saw demand for different policy types evolve. Yield-based policies dominated in the early 1990s, but in 1996, newly available revenue-based policies began absorbing a larger share of insured acres, accounting for more than two-thirds of all insured area by 2016.”
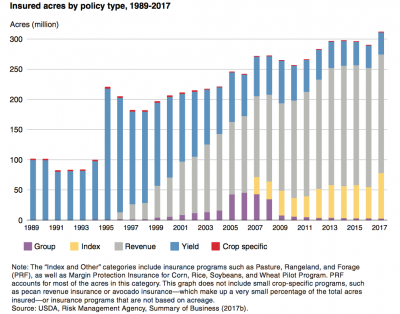
The report added, “Figure 3 illustrates the year-to-year changes of each crop’s portion of total insured acres since 1989. The proportion of insured acres for corn, soybeans, cotton, and rice changed very little.”
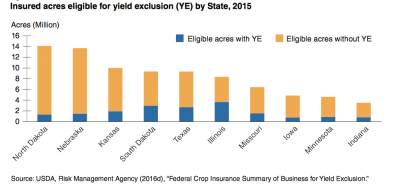
Also on crop insurance, the authors pointed out that, “Although the 2014 Farm Act did not change premium subsidy rates, it did offer farmers the chance to omit very low yields from their production history, a feature called Yield Exclusion (YE). By omitting low yields, farmers can potentially achieve higher insurance revenue or yield guarantees…[a] producer’s historical yield (Actual Production History, or APH) is eligible for Yield Exclusion if the county yield (or the yield of a contiguous county) in a given year is below 50 percent of the previous 10 consecutive-year average.”
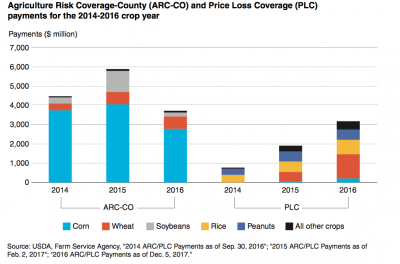
Last week’s report stated that, “Overall, commodity prices have decreased since producers made their ARC/PLC election decision, causing crop revenues to fall from 2014 to 2016. Differences in program design between ARC and PLC led to differences across program payouts.
For corn, the payment difference for enrollees in ARC-CO or PLC shrank between 2014 and 2016, while the difference in payments for soybeans grew.
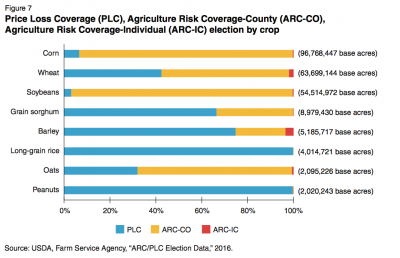
The ERS report noted that, “Figure 7 shows the percentage shares of ARC-CO, ARC-IC, and PLC election for the eight crops with the most base acres. Corn and soybean producers heavily favored ARC-CO, while rice and peanut farmers almost exclusively elected PLC. Many wheat producers chose ARC-CO, but a sizable minority chose PLC.”
While addressing payment levels, the authors indicated that, “Over the crop year period 2014-2016, payments to corn producers averaged over $3.5 billion. Wheat and soybean payments followed distantly with a yearly average of around $547 and $539 million, respectively. Soybean producers saw their ARC payments triple from 2014 to 2015 due to a drop in soybean prices over the same period and a simultaneous loss in yields in many soybean-growing counties. From 2014 to 2016, PLC payments rose from around $774 million to nearly $3.2 billion, mainly due to greater payments to wheat acres.”
After a closer look at dairy and livestock programs, the ERS report concluding by saying, “In combination with their own on-farm strategies, agriculture, livestock, and dairy producers participate in a variety of Federal risk management programs to address production and market uncertainties. These programs offer producers the opportunity to reduce downside risk to their revenues. Differences across commodities, locations, and time periods can account for these programs’ varying risk and revenue effects, which, along with participation costs and coverage rates, ultimately explain observed levels of program enrollments and outlays.”


