


E&E News’ Grace Yarrow reported that, “Bayer is withdrawing its request that the Trump administration impose countervailing duties on glyphosate imports from China after backlash from the agriculture industry.” “The…
USDA-NASS Updates Provide Snapshot of Farm Economy Variables
On Thursday, USDA’s National Agricultural Statistics Service (NASS) released three updates that provide current insight into the state of the U.S. agricultural economy. The releases focused on land values, cash rents, and production expenditures.
Land Values
In its annual Land Values summary, NASS indicated that, “The United States cropland value averaged $4,130 per acre, an increase of $40 per acre from the previous year. In the Southern Plains region, the average cropland value increased 4.7 percent from the previous year, while in the Lake region, cropland values decreased by 0.6 percent.”

The NASS update also included this more detailed state-by-state graphical look at changes in average cropland values from 2017.

More specific to Illinois, Thursday’s report included this table which indicated that Illinois land values in 2018 averaged $7,450, up 1.4 percent from 2017. In 2014, the average value was $7,700.

Indiana’s cropland value was $6,700 in 2018, unchanged from last year.
A news release Thursday from the NASS Upper Midwest Regional Field Office stated that, “[The Iowa] cropland value, at $8,100 per acre, was unchanged from last year. Pasture value remained unchanged from 2017 at $3,100 per acre.”
In 2014, the average value was $8,750.

Cash Rents
Also on Thursday, NASS updated its Quick Stats Database for Cash Rents.
In Illinois, the 2018 average cash rent for cropland is $223, which is up from $218 in 2017 and from $221 in 2016.
The Indiana average cash cropland rent in 2018 is $198.
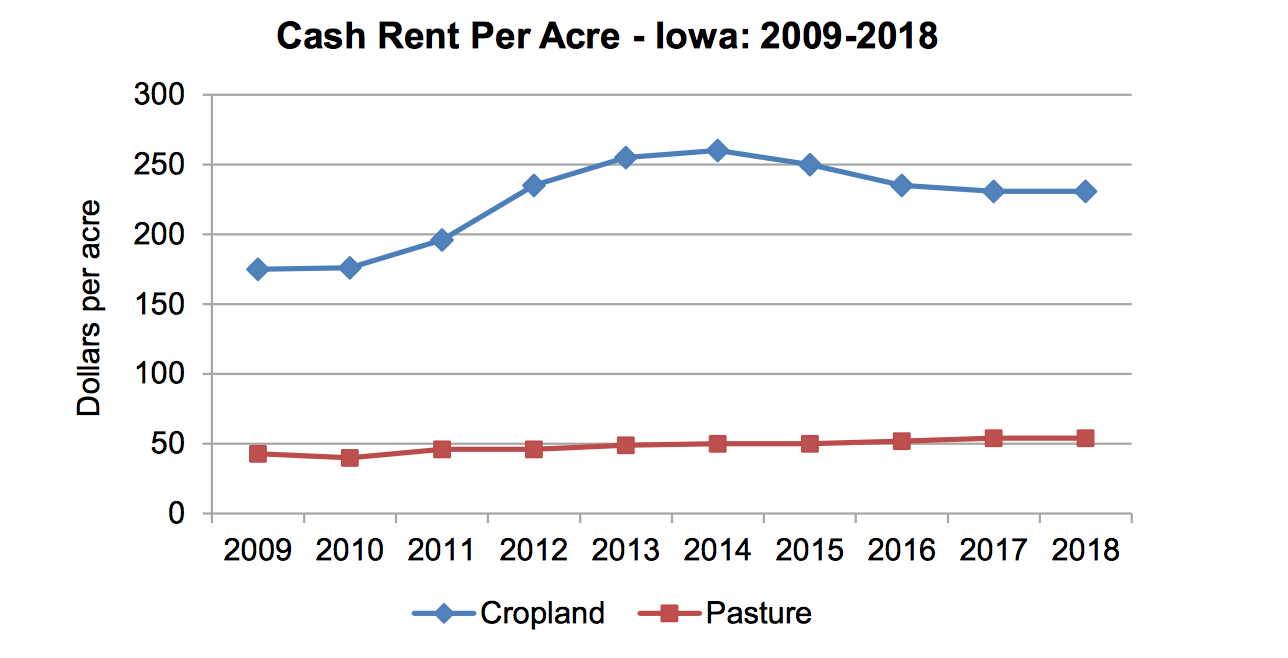
A news update from the NASS Iowa Field Office last week indicated that, “Cropland cash rent paid to Iowa landlords in 2018 averaged $231.00 per acre according to the USDA, National Agricultural Statistics Service. Non-irrigated cropland rent averaged $231.00 per acre, unchanged from last year.”
Production Expenses
With respect to production expenses, NASS released its Farm Production Expenditures 2017 Summary on Thursday as well.
The report stated that, “Farm production expenditures in the United States are estimated at $359.8 billion for 2017, up from $346.9 billion in 2016. The 2017 total farm production expenditures are up 3.7 percent compared with 2016 total farm production expenditures.”
The report added, “In 2017, the United States total farm expenditure average per farm is $176,352, up 4.3 percent from $169,035 in 2016.”

Total farm production expenses in Illinois in 2017 were $16.8 million, up from $15.8 million in 2016.
Indiana production expenses totaled $10.3 million in 2017.

A news release Thursday from the NASS Iowa Field Office stated that, “Iowa farm production expenditures totaled $26.4 billion in 2017, according to the latest USDA, National Agricultural Statistics Service – Farm Production Expenditures Annual Summary report. This was $55 million more than the 2016 total expenditures.”
