Bloomberg's Leah Nylen reported Thursday that "a Colorado judge issued an order temporarily blocking the proposed $25 billion merger of Kroger Co. and Albertsons Cos., which has been challenged by…
2018 Farm Sector Income Forecast, November
The USDA’s Economic Research Service (ERS) indicated on Friday that, “Net farm income, a broad measure of profits, is forecast to decrease $9.1 billion (12.1 percent) from 2017 to $66.3 billion in 2018, after increasing $13.8 billion (22.5 percent) in 2017. Net cash farm income is forecast to decrease $8.5 billion (8.4 percent) to $93.4 billion.
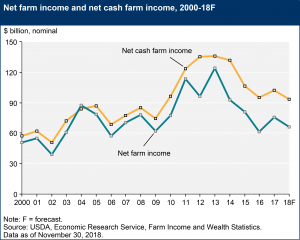
“In inflation-adjusted 2018 dollars, net farm income is forecast to decline $10.8 billion (14.1 percent) from 2017 after increasing $13.0 billion (20.2 percent) in 2017.
If realized, inflation-adjusted net farm income would be 3.3 percent above its level in 2016, which was its lowest level since 2002.
With respect to receipts, ERS explained that, “Crop cash receipts are forecast to be $199.2 billion in 2018, an increase of $3.0 billion (1.5 percent) from 2017.”
More narrowly, “In nominal terms, corn receipts are expected to rise $1.9 billion (4.1 percent) in 2018, reflecting higher prices. Wheat receipts are expected to increase over $0.4 billion (5.1 percent) from 2017 as a predicted decline in quantity sold is more than offset by an expected increase in the price of wheat. Soybean receipts in 2018 are expected to increase ($1.8 billion or 4.6 percent) as an anticipated price decline is more than offset by higher expected quantities sold.”
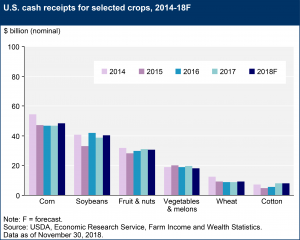
Meanwhile, “Total animal/animal product cash receipts are expected to fall $0.4 billion (0.2 percent) to $175.6 billion in 2018.”

While discussing commodity program payments, ERS noted that, “Payments under the 2018 Price Loss Coverage (PLC) and Agriculture Risk Coverage (ARC) programs are expected to decline due to higher 2017/2018 market prices for most key crops (those that generated the majority of past years’ PLC and ARC payments).”
Also, “Conservation payments—reflecting the financial assistance programs of USDA’s Farm Service Agency and Natural Resources Conservation Service—are expected to exceed $3.9 billion in 2018, up 2.5 percent from 2017.”
ERS pointed out that, “The large increase in the 2018 forecast for the miscellaneous programs category [or the “all other payments,” in the graph below- purple] reflects payments from the Market Facilitation Program. This program provides direct payments to assist corn, cotton, sorghum, soybean, wheat, dairy, hog, shelled almond, and fresh sweet cherry producers in response to trade disruptions. The forecast reflects payments issued on the first 50 percent of U.S. producers’ total production of the commodity.”
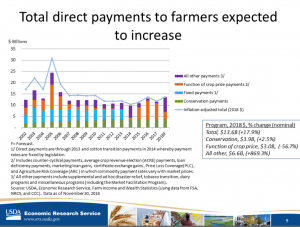
Federal crop insurance represents another aspect of net farm income, and is represented in the graph below from Friday’s ERS Webinar: “Farm Income and Financial Forecasts, November 2018 Update.”

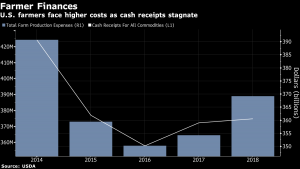
In a look at production costs, Friday’s update pointed out that, “In 2018, production expenses are forecast at $369.1 billion, up 4.2 percent ($14.8 billion) from 2017, with most categories of expenses projected to increase.”

Bloomberg writer Shruti Singh reported Friday that, “U.S. farmers face rising production costs as bumper harvests and a trade war with China erode cash from crop and livestock sales.”
Friday’s update also provided a perspective on farm household income, and stated that, “Farm households typically receive income from both farm and off-farm sources. Median farm income earned by farm households is estimated at -$800 in 2017 in nominal terms and is forecast to decline to -$1,548 in 2018.”
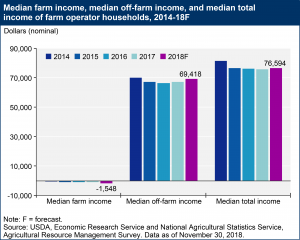
“In recent years, slightly more than half of farm households have had negative farm income each year. Many of these households rely on off-farm income—and median off-farm income is forecast to increase 2.8 percent from $67,500 in 2017 to $69,418 in 2018.”


