


Senate Agriculture Chair John Boozman said Monday he plans to soon take up a five-year farm bill, regardless of delays a similar bill may face in the House. Asked at…
Trends in USDA Nutrition Programs, the Largest Farm Bill Expenditures
The U.S. Department of Agriculture’s Economic Research Service (ERS) recently released a report (“The Food Assistance Landscape: FY 2018 Annual Report,” by Victor Oliveira) that examined “trends in U.S. food and nutrition assistance programs through fiscal 2018.” The 15 domestic food and nutrition assistance programs administered by USDA account for over two-thirds of the Department’s annual budget. Today’s update includes highlights from the ERS report.
The report stated that, “Federal food expenditures for USDA’s domestic food and nutrition assistance programs totaled $96.1 billion in fiscal year (FY) 2018, or 3 percent less than in the previous fiscal year. This was the lowest amount since FY 2010 and 12 percent lower than the historical high of $109.2 billion set in FY 2013.”

More specifically, the report explained that, “The five largest food and nutrition assistance programs in FY 2018—the Supplemental Nutrition Assistance Program (SNAP); the National School Lunch Program; the Special Supplemental Nutrition Program for Women, Infants, and Children (WIC); the School Breakfast Program; and the Child and Adult Care Food Program—accounted for 96 percent of total USDA expenditures for domestic food and nutrition assistance. Expenditures in FY 2018 fell substantially for SNAP and WIC but increased to varying degrees for the other three programs.”

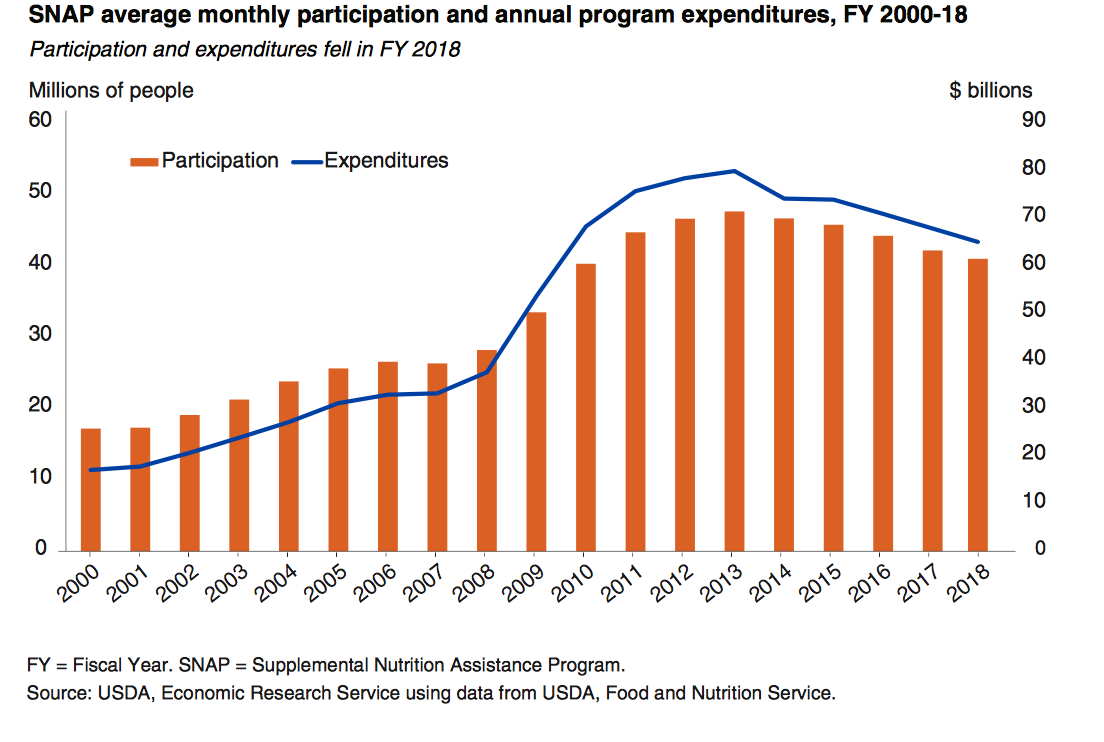
With respect to the SNAP program, Mr. Oliveira pointed out that, “On average, 40.3 million people per month participated in the program, 4 percent fewer than in the previous fiscal year and 15 percent less than the historical high average of 47.6 million per month in FY 2013.
“FY 2018 marked the fifth consecutive year that participation decreased after increasing in 12 of the previous 13 years. Fiscal year 2018’s decrease in the number of participants in large part reflects the continued improvement in economic conditions at the national level.”
“Per person benefits averaged $125.25 per month, about the same as in the previous fiscal year.”
The ERS report noted that, “SNAP’s share of the population was between 6 and 9 percent from 2000 to 2007 and then increased more sharply as economic conditions deteriorated during and immediately after the Great Recession (which lasted from December 2007 to June 2009) before peaking in 2013 when over 15 percent of the U.S. population participated in the program each month. Since then, SNAP’s share of the population has steadily fallen each year as economic conditions have improved. In 2018, 12 percent of the population participated in the program, still above pre-recession levels.”

Regarding the WIC program, ERS indicated that, “On average, 6.9 million people per month participated in the program, 6 percent fewer than in the previous fiscal year.
This was the largest single-year decrease in the program’s history.
“Children made up about half (51 percent) of all participants, while infants constituted 25 percent and women constituted about 24 percent.”
“Food costs per person averaged $40.83 per month, or about 1 percent less than in the previous fiscal year.”

Turning to the school lunch and school breakfast programs, ERS stated that, “On average, 29.7 million children participated in the National School Lunch Program each schoolday, 1 percent fewer than in the previous fiscal year. Average participation was at a 13-year low and about 7 percent lower than in FY 2011, when average daily participation peaked at 31.8 million. Participation has decreased in 6 of the last 7 years.”

“An average of 14.7 million children participated in the [School Breakfast Program] each schoolday (or about half the number who participated in the National School Lunch Program). This was an increase of less than 1 percent from the previous scal year and the smallest annual percentage increase since 1982,” the ERS report said.