


Senate Agriculture Chair John Boozman said Monday he plans to soon take up a five-year farm bill, regardless of delays a similar bill may face in the House. Asked at…
Recent Perspectives on U.S. Farmland Values
On Thursday, the Federal Reserve Bank of Chicago released a report providing an outlook on farmland values and agricultural credit conditions for the second quarter of 2019. Recall that other Federal Reserve Districts released similar reports last week. A summary of Federal Reserve District agricultural land value and credit reports from the first quarter of 2019 can be found here. Meanwhile, recent updates from USDA’s National Agricultural Statistics Service and Purdue University have also provided additional perspective on farmland values.
Federal Reserve Bank of Chicago
David Oppedahl, a Senior Business Economist at the Chicago Fed, explained in The AgLetter that, “Farmland values for the Seventh Federal Reserve District were down 1 percent in the second quarter of 2019 from a year earlier.

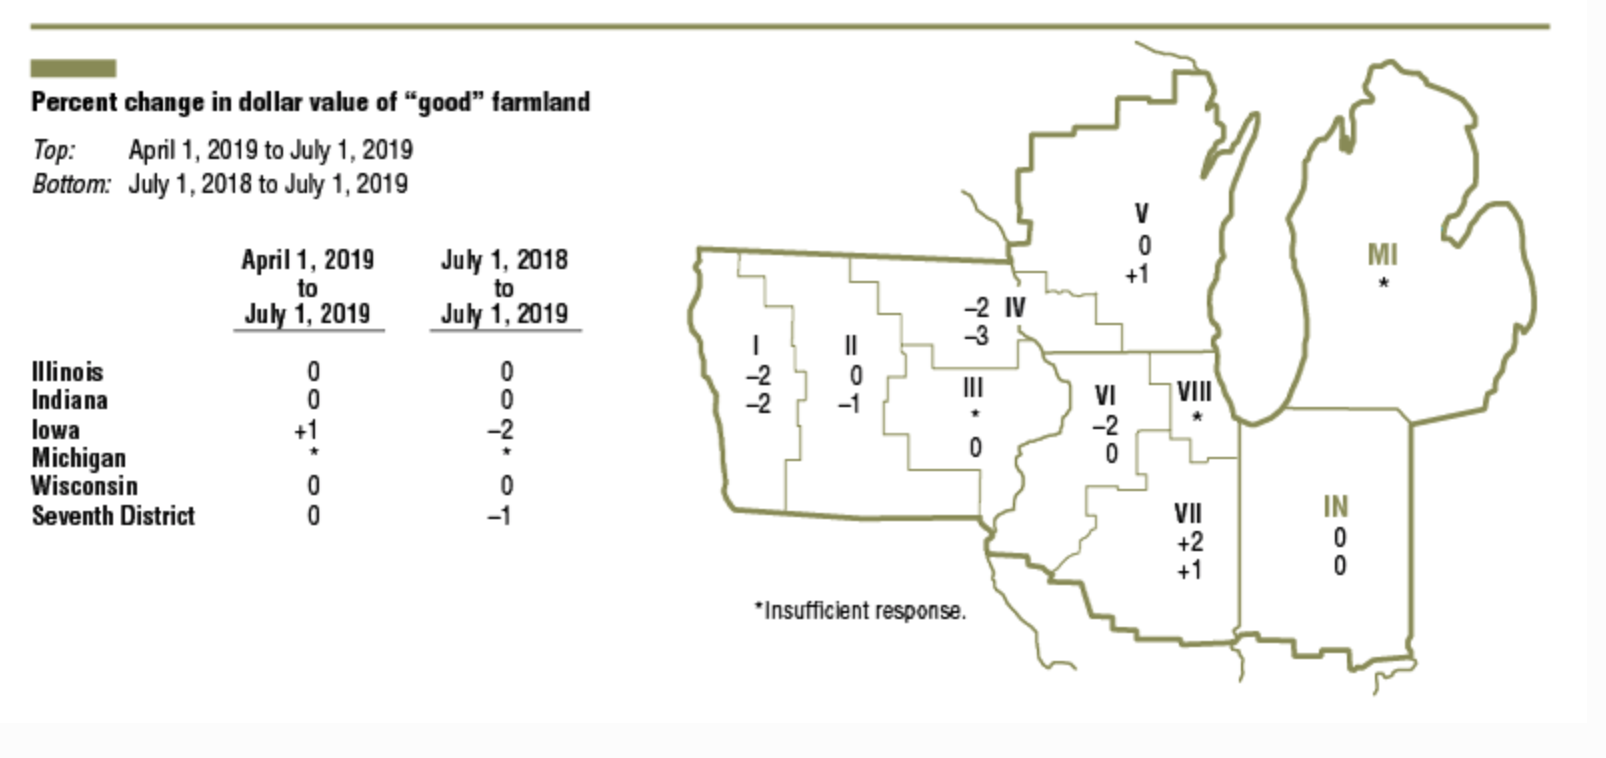
“However, values for ‘good‘ agricultural land in the District were unchanged from the first quarter to the second quarter of 2019, according to a survey of 157 bankers.
Excessive precipitation in the spring led to historic flooding and widespread planting delays across most of the Midwest. Reporting bankers indicated that 69 percent of their borrowers were at least modestly affected by extreme weather events in the first half of 2019.
The AgLetter noted that, “In the second quarter of 2019, agricultural credit conditions for the District were weaker compared with a year ago once again. Repayment rates for non-real-estate farm loans were lower in the second quarter of 2019 than a year earlier. The portion of the District’s agricultural loan portfolio reported as having ‘major’ or ‘severe’ repayment problems (6.2 percent) had not been higher in the second quarter of a year since 1999.”
The Chicago Fed indicated that, “Overall, District farmland values were the same in the second quarter of 2019 as in the first quarter. Yet, there was a year-over-year decrease of 1 percent in District agricultural land values (the first such decline since the third quarter of 2017). Iowa and Michigan had year-over-year dips in their farmland values, but Illinois, Indiana, and Wisconsin farmland values held steady (see map and table below, but note that too few Michigan bankers responded to report a numerical change in farmland values).”
Thursday’s update explained that, “Muted expectations for farm income continued to be a factor in sliding real farmland values. A significant portion of Midwest farm income depends on the production of two primary crops: corn and soybeans. Because of unusual wetness, many farmers had to delay planting corn and soybeans this year, and a much higher share of fields than normal were not even planted in 2019. According to responding bankers, 45 percent of their agricultural borrowers were modestly affected by bad weather conditions in the first half of the year and another 24 percent were significantly affected.”
UPDATE: "In the long term, some of these #agricultural markets will not come back." David Oppedahl discusses #tariffs, weather and deteriorating #credit conditions for the the Midwest agriculture industry in a new AgLetter. https://t.co/oSET3uriF0 pic.twitter.com/40YtnUSy9X
— ChicagoFed (@ChicagoFed) August 15, 2019
The report added that, “With lower yields expected across the Midwest, corn and soybean prices should adjust upward. Indeed, corn and soybean prices climbed 9.6 percent and 3.6 percent, respectively, in June from May.
The average price received by #farmers for #corn during June in #Iowa was $3.95 per bushel. This was up 36 cents from the May price and 41 cents above June 2018, @usda_nass pic.twitter.com/W3f7Gdetdu
— Farm Policy (@FarmPolicy) July 31, 2019
However, tariffs on agricultural exports are limiting how much these crop prices can increase. It seems unlikely that these prices will rise enough to compensate for lost output, so the profitability of many corn and soybean farms will almost surely fall from their 2018 levels—possibly by a lot for some.
Looking ahead, the Chicago Fed stated that, “Even with crop output expected to fall, most survey respondents anticipated District farmland values would be stable in the short term, as 83 percent of responding bankers projected no change in farmland values for the third quarter of 2019.”
USDA- NASS, Land Values 2019 Summary
More broadly, USDA’s National Agricultural Statistics Service (NASS) released its annually Land Values summary last week, which stated that, “The United States farm real estate value, a measurement of the value of all land and buildings on farms, averaged $3,160 per acre for 2019, up $60 per acre (1.9 percent) from 2018. The United States cropland value averaged $4,100 per acre, an increase of $50 per acre (1.2 percent) from the previous year.”


Over the last five years a handful of states have seen #agricultural and #farmland values decline, @IowaFarmBureau -14%, @NEFarmBureau -8%, @KSFarmBureau -5%, @ILFarmBureau -3%, @INFarmBureau -4%, @ndfb -3% & @NVFarmBureau -4% @FarmBureau pic.twitter.com/T1NId3upN7
— John Newton (@New10_AgEcon) August 7, 2019
Purdue University- A Closer Look at Indiana Farmland Values
With respect to Indiana farmland values, the Purdue Agricultural Economics Report this month pointed out that, “Statewide the 2019 Purdue Farmland Value Survey indicates farmland values moved lower.

“June year-to-year farmland value comparisons indicate top quality farmland declined 5.3%, average quality farmland declined 0.9%, and the poor quality farmland decline was so small it resulted in a 0.0% change.”