Farm Progress' Joshua Baethge reported at the end of last week that "it’s hard to find anyone optimistic about passing a new farm bill this year. While the two political…
CRS Report: Farm Bill Revenue Support, 2014-2020
A report last month from the Congressional Research Service (CRS), “U.S. Farm Policy: Revenue Support Program Outlays, 2014-2020,” stated that, “Provisions of Title I of the 2018 farm bill (Agriculture Improvement Act of 2018; P.L. 115-334) authorize a set of revenue support programs for major program crops for crop years 2019-2023 as part of the so-called farm safety net. This includes three principal revenue support programs— Marketing Assistance Loan (MAL), Agricultural Risk Coverage (ARC), and Price Loss Coverage (PLC).”
The CRS update noted that, “The ARC and PLC programs were first authorized under the 2014 farm bill (Agricultural Act of 2014; P.L. 113-79) for the crop years 2014-2018. At the start of the 2014 farm bill, participating producers were offered a one-time opportunity to enroll their historical program acres (referred to as “base”acres), on a crop-by-crop basis, for either ARC or PLC.”
“Under the 2014 sign- up, producers enrolled 260 million base acres for 20 covered commodities. The three largest crops in terms of base acres—corn, soybeans, and wheat—accounted for 83% of enrolled base acres,” the report said.
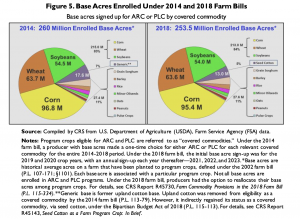
Last month’s report explained that, “Under the 2019 sign-up and reallocation, producers enrolled 253.5 million base acres in ARC and PLC—a decline of 6.5 million acres from the 2014 enrollment. A large portion of the difference in base acres was the result of the reassignment of generic base acres. Generic base acres were created in 2014 when upland cotton was removed from eligibility for ARC and PLC payments. In 2018, when the Bipartisan Budget Agreement (P.L. 115-123) added seed cotton as a covered commodity, generic base acres needed to be either assigned to a covered commodity or eliminated. Of the 17.6 million acres of former generic base, 13 million were reallocated to seed cotton with the balance either enrolling under other covered commodities or dropping out of participation—likely accounting for a substantial portion of the decline in total enrolled base acres. The share of total base acres for the top three crops—corn, soybeans, and wheat—increased from 83% to 84%.”
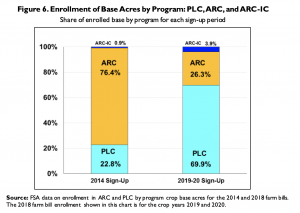
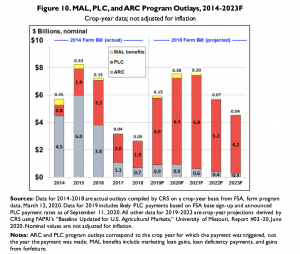
“Under the 2014 farm bill, most base acres (76.4%) were enrolled in the county-level ARC program, compared with 22.8% base acres enrolled in PLC,” the report said; adding that, “Total ARC participation fell from 76.4% under the 2014 sign-up to 26.3% under the 2019-2020 sign-up, while PLC participation rose from 22.8% to 69.9%.”
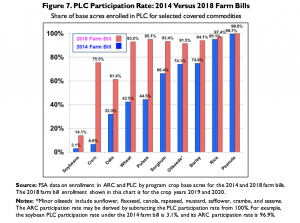
“The high enrollment share for ARC under the 2014 sign-up for corn, soybeans, and wheat was due to their high farm prices during the 2010-2013 period,” the report said.
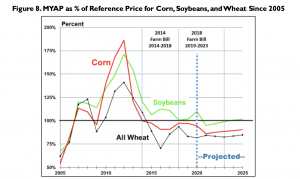
However, “By 2017, declining MYAPs [ market-year average farm price] from the 2014-2016 period had dampened the price component of the ARC revenue guarantee and reduced ARC payments in 2017 and 2018.”
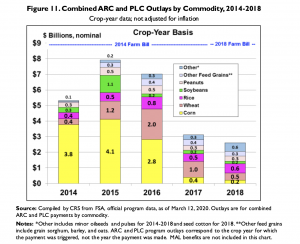
With respect to outlays by commodity, CRS pointed out that, “During the 2014 farm bill’s five-year period, corn accounted for $11.3 billion (or 44%) of total combined ARC and PLC payments. Wheat accounted for $5.0 billion (19%), rice for $2.8 billion (11%), soybeans for $2.0 billion (8%), peanuts for $2.0 billion (8%), other feed grains for $1.5 billion (6%), and the remainder for $1.4 billion (5%). However, the payments were not evenly distributed over time—most of the payments to corn base acres came during the first three years of the 2014 farm bill (2014-2016), when corn received $10.7 billion in combined ARC and PLC outlays.”
CRS noted that its report “is a starting point for a discussion of how well the MAL, ARC, and PLC programs have performed as farm safety net programs. It is intended to provide some context for future congressional consideration of farm policy, particularly in light of the substantial volume of ad hoc farm support payments that have been paid out in recent years, which are independent of farm-bill-authorized farm safety net programs.
During the past three years (2018-2020), USDA has been expected to pay as much as $39 billion over and above the farm bill’s traditional support through MAL, ARC, and PLC, including $8.6 billion under the 2018 Market Facilitation Payment program, $14.5 billion under the 2019 Market Facilitation Payment program, and potentially $16 billion under the 2020 Coronavirus Food Assistance Program.
“This is in comparison to an estimated $11.5 billion in MAL, ARC, and PLC payments over the same 2018-2020 period.”


