President Donald Trump on Friday signed an executive order temporarily expanding the amount of beef the U.S. can import from Argentina, a move the White House says is aimed at…
U.S. Wheat Exports “Projected at 52-Year Low,” While U.S., Mexico Corn Dispute Continues
In its monthly Wheat Outlook report earlier this week, the USDA’s Economic Research Service (ERS) indicated that, “U.S. all-wheat exports are lowered 25 million bushels to 700 million bushels, the lowest since 1971/72.
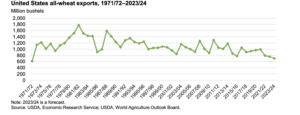
“Despite an increase in Hard Red Winter (HRW) production, exports for HRW are cut 25 million bushels to 165 million, the lowest level since by-class supply and utilization records began in 1973/74. U.S. exports of HRW remain uncompetitive on the global market as shown in shipment and sales data. HRW exports in June 2023 were 10 million bushels, down from 19.2 million bushels in June 2022. Using data from the USDA, Foreign Agricultural Service’s Export Sales Reporting, all-wheat U.S. total commitments (the sum of accumulated exports and outstanding sales) are about 6.4 million metric tons as of August 3, down 26 percent from the same point last year and 37 percent below the recent 10-year average at this point (2013/14–2022/23). HRW total commitments are down 53 percent compared with last year as shipments from Russia and the European Union remain competitive internationally.”
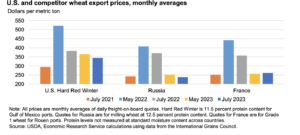
This week’s update added that, “Wheat prices reached historic highs in May 2022. Since then, U.S. and global wheat prices have cooled as supply concerns in many key wheat exporting countries subsided.
Wheat export prices for the United States, Russia, and France in July 2023 are well below the peaks observed in May 2022 after Russia invaded Ukraine in February 2022.
“Large exportable supplies in Russia and France have contributed to low prices for those exporters. Russia’s total is forecast above 100 million metric tons (MMT) for the second consecutive year, despite lower production in 2023/24 due to large carryover stocks. Wheat production for France in 2023/24 is forecast to recover from the dry condition in 2022/23.”
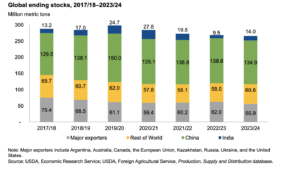
The ERS report also noted that, “Global ending stocks are lowered 0.9 MMT to 265.6 MMT largely driven by lower ending stocks for China—down 2.2 MMT to 134.9 MMT on reduced production. Major exporters ending stocks are raised 1.2 MMT to 55.9 MMT.”
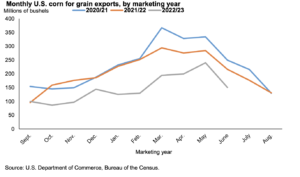
Also this week, in its monthly Feed Outlook report, ERS explained that, “Corn exports are reduced 25 million bushels this month to 1.625 billion. The weak pace of exports continues into the last quarter of the marketing year, with June exports totaling 150.4 million bushels, down approximately 66 million bushels from June 2022. Corn exports through the first 10 months of the marketing year sit at 1.466 billion bushels. A sluggish pace to corn export inspections through July and early August point toward weaker corn exports to close out the marketing year.”
With a focus on Chinese corn demand, the Outlook also pointed out that, “China has become one of the top global corn importers since 2020/2021, driven to a large extent by dual transformations of the country’s swine farming and feed milling industries. Imports have exceeded China’s 7.2-million-metric-ton annual import quota by a wide margin each year since calendar year 2020, even though no changes in the quota system have been announced.
“China’s corn imports are regulated by a tariff-rate quota system [TRQ] set up in 2001, when the country joined the World Trade Organization.”
ERS noted that, “The jump in corn TRQ applicants and imports since 2020/21 corresponds to a tighter corn market in China, signaled by a jump in corn prices for China of more than 70 percent during 2020.
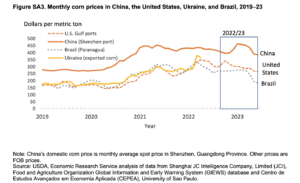
“After peaking at $462 per metric tons in January 2021, domestic corn prices in China fluctuated at a relatively high level during 2021–22. Corn prices for the U.S. Gulf, Ukraine and Brazil rose 4 months later, at a more gradual pace than China’s prices during 2020, peaking at around $320 per metric ton in May 2021.
The surge of imports by China during 2020/21 corresponded to a spread between domestic (China) and imported corn prices, beginning in April 2020.
“For example, the difference between the price in China’s Shenzhen port and U.S. Gulf ports doubled from $110 per metric ton to more than $220 per metric ton between January 2020 and January 2021. Ocean freight rates increased from $32 per metric ton to $42 per metric ton over the same period.”
The Outlook stated that, “Imports slowed during 2021/22 and 2022/23, as the price spread narrowed, but the volume of imports remained high compared to China’s pre-2020 imports. Reports of a record harvest for Brazil led to a decline in corn prices during calendar year 2023. Prices in the U.S. and China declined at a more moderate pace. China’s approval of corn from Brazil for access to the China market in late 2022 magnified the influence of Brazil’s price decline and there were news reports of importers from China switching purchases from corn sourced from the United States to Brazil.
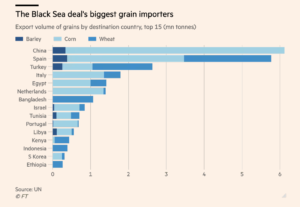
“The Black Sea Grain Initiative allowed China to resume large imports from Ukraine, swelling monthly corn imports to a peak of 2-to-3 million metric tons during January-March 2023.”
Meanwhile, Bloomberg writer Eric Martin reported today that, “The US is preparing to accelerate its complaint that Mexico’s ban on genetically modified corn violates the nations’ free-trade deal, heightening tensions between neighbors.
“The US Trade Representative’s office plans to request the formation of a dispute resolution panel under the US-Mexico-Canada Agreement on Thursday, according to people familiar with the matter, who asked not to be identified without permission to speak publicly.”
Martin added that, “American officials have repeatedly criticized the Mexican government’s prohibition on GMO corn for human consumption, calling the policy unscientific. GMO corn for animals is allowed.”


