


Price indicators for key farm inputs tumbled on Monday following news of the U.S.-Iran preliminary peace deal. The value of urea at New Orleans, a benchmark for North American nitrogen…
Recent NASS Reports Provide Insight Into the Agricultural Sector and Farm Economy
The USDA’s National Agricultural Statistics Service (NASS) released several reports over the past few weeks that provide helpful insight into segments of the U.S. agricultural economy and farm sector. Today’s update highlights some of these reports, which include details on U.S. farm characteristics, farms and land in farms, crop values, and agricultural prices.
Farm Characteristics
In January, NASS released its Farm Typology Report, which included more detailed information from the 2017 Census of Agriculture.
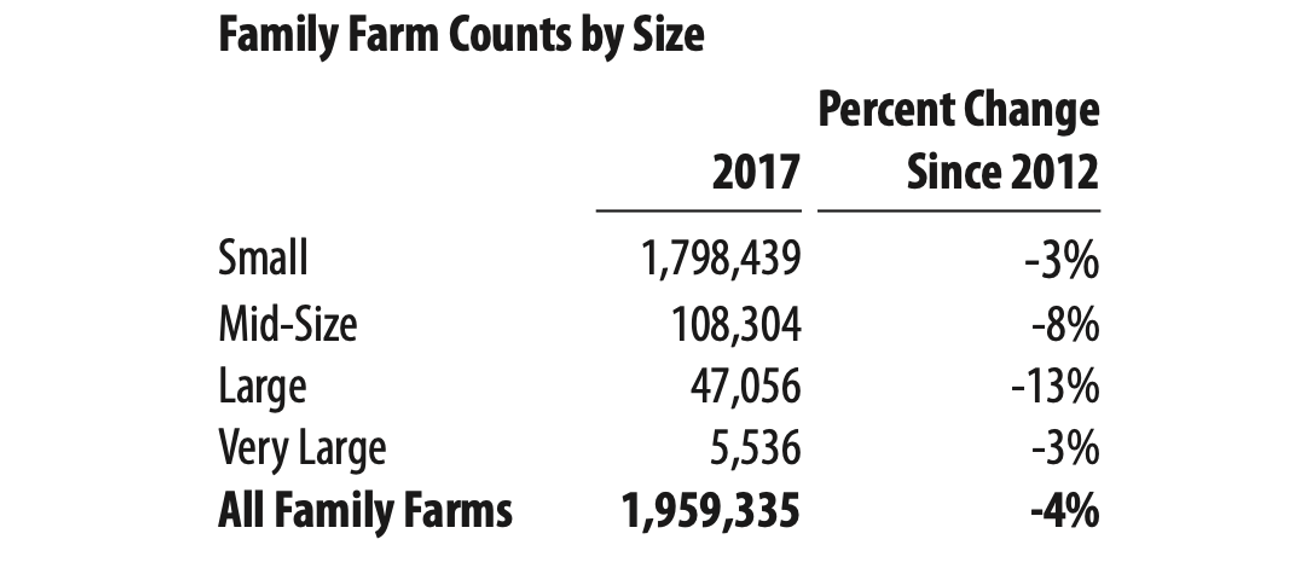
The report stated that, “In 2017, 96% of U.S. farms were family-owned. Small family farms account for 88% of all U.S. farms, 46% of land in farms, and 19% of the value of all agricultural products sold.
Large-scale family farms made up less than 3% of all U.S. farms, but produced 43% of the value of all agricultural products.
“Mid- size family farms accounted for 5% of U.S. farms, and produced 20% of the value of all agricultural products.”

The January update pointed out that, “The number of family farms decreased from 2012 to 2017, down almost 80,000 farms or 4%. Larger decreases occurred for mid-size and large family farms, down 8% and 13%, respectively. There were 82,885 non-family farms in the U.S. in 2017, up 18% from 2012.”
The report added that, “Very large farms are more likely to specialize in dairy production or specialty crops (vegetables, fruits and horticulture); 29% of very large farms specialize in specialty crops and 28% specialize in dairy production.”

Farms and Land in Farms
Last month, NASS released its Farms and Land in Farms 2020 Summary. This annual report indicated that, “The number of farms in the United States for 2020 is estimated at 2,019,000, down 4,400 farms from 2019. The number of farms in all sales classes declined. In 2020, 51.1 percent of all farms had less than $10,000 in sales and 81.5 percent of all farms had less than $100,000 in sales. In 2020, 7.4 percent of all farms had sales of $500,000 or more.”

The report stated that, “Total land in farms, at 896,600,000 acres, decreased 800,000 acres from 2019. The biggest change for 2020 is that producers in Sales Class $10,000 – $99,999 operated 550,000 fewer acres than in 2019. In 2020, 30.1 percent of all farmland was operated by farms with less than $100,000 in sales, while 40.8 percent of all farmland was operated by farms with sales of $500,000 or more.”

The NASS report added that, “The average farm size for 2020 is 444 acres, unchanged from the previous year.”

The total number of #farms in #Iowa in 2020 was 85,000, down 300 farms from 2019, @usda_nass pic.twitter.com/5unVi1BWiN
— Farm Policy (@FarmPolicy) February 20, 2021
Crop Values
Also last month, NASS released its annual Crop Values summary (2020), which showed that the value of production for corn, soybeans and wheat in 2020 had increased significantly from 2019.

Iowa and Illinois were leaders in State level corn production values.

For soybeans, Illinois had the highest value of production in 2020.


Agricultural Prices
In its monthly Agricultural Prices report last week, NASS stated that, “The corn price, at $4.24 per bushel, is up 27 cents from last month and 45 cents from January 2020.”

“The soybean price, at $10.90 per bushel, is 40 cents higher than December and $2.06 higher than January 2020.”

And, “The January price for all wheat, at $5.48 per bushel, is 5 cents higher than December and 60 cents higher than January 2020.”

