


Deputy Agriculture Secretary Stephen Vaden said he expects China to honor its pledge to buy more American soybeans this year. Vaden said at The Wall Street Journal’s Global Food Forum…
Farm Production Expenditures Climb 15.2 Percent in 2022
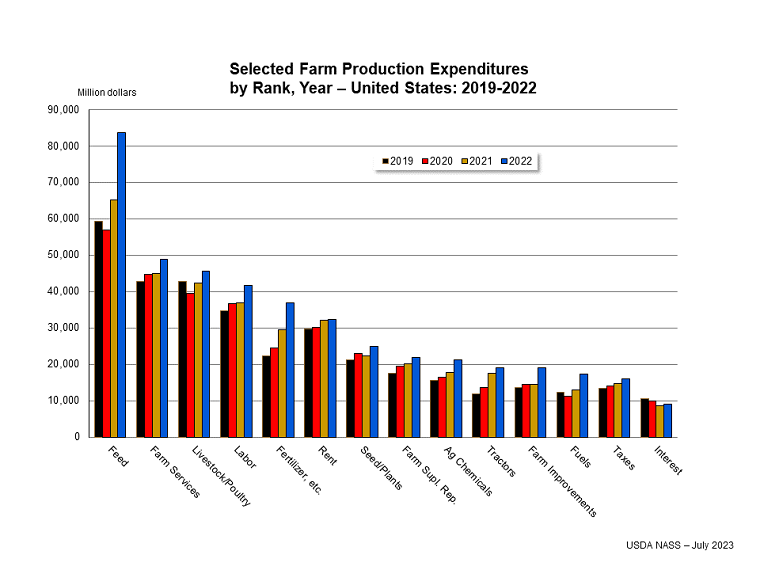
In its annual Farm Production Expenditures report on Friday, the USDA’s National Agricultural Statistics Service (NASS) indicated that, “Farm production expenditures in the United States are estimated at $452.7 billion for 2022, up from $392.9 billion in 2021.
The 2022 total farm production expenditures are up 15.2 percent compared with 2021 total farm production expenditures.
“All 17-line items showed an increase from the previous year.”

Friday’s report noted that, “The four largest expenditures at the United States level total $219.6 billion and account for 48.5 percent of total expenditures in 2022. These include feed, 18.5 percent, farm services, 10.8 percent, livestock, poultry, and related expenses, 10.1 percent, and labor, 9.2 percent.”
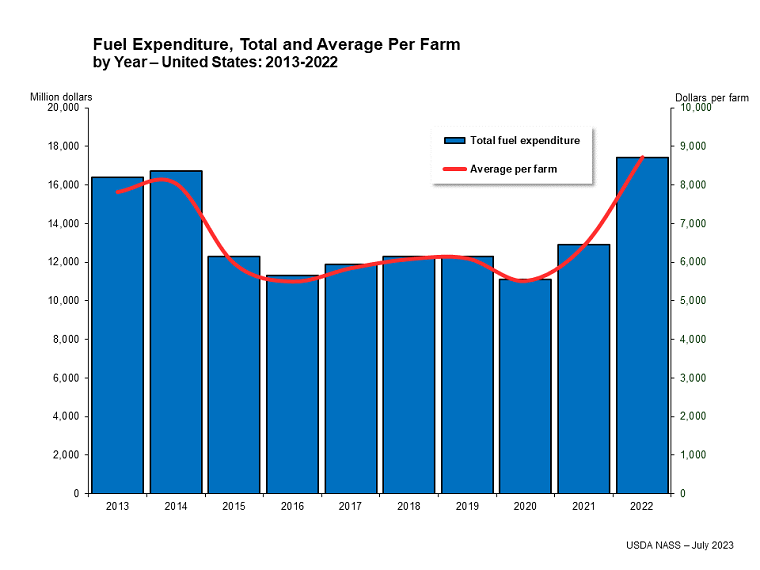
“In 2022, the United States total farm expenditure average per farm is $226,986, up 15.8 percent from $196,087 in 2021,” the report said.
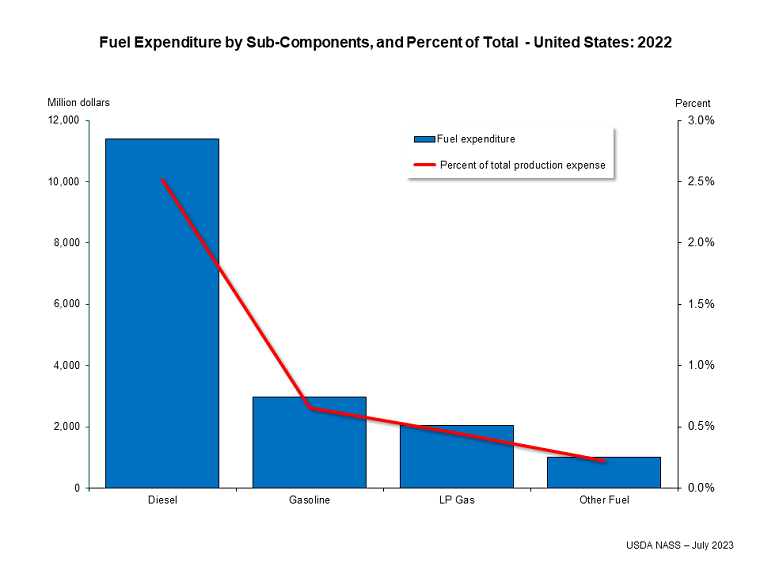
More narrowly, the NASS report pointed out that, “Total fuel expense is $17.4 billion.
“Diesel, the largest sub-component, is $11.4 billion, accounting for 65.5 percent. Diesel expenditures are up 35.4 percent from the previous year. Gasoline is $3.0 billion, up 22.2 percent. LP gas is $2.0 billion, up 41.0 percent. Other fuel is $1,000 million, up 63.9 percent.”
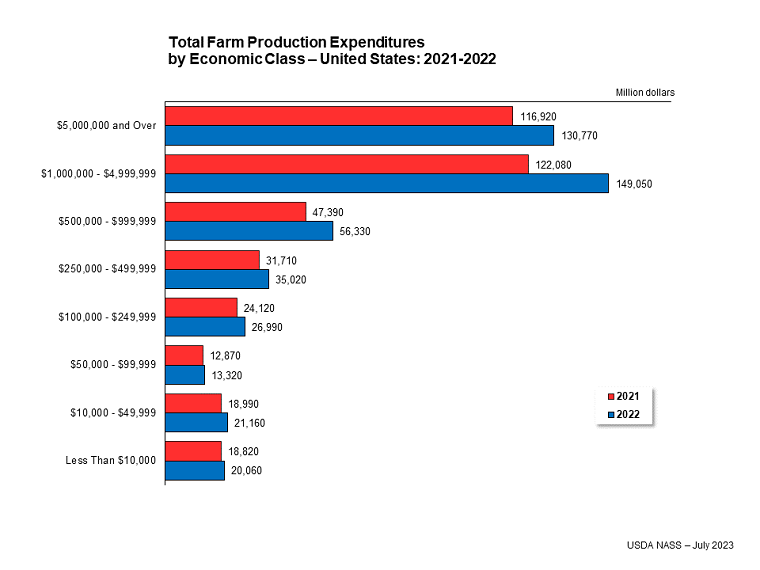
In a further breakdown of expenses, the report explained that, “The United States economic sales class contributing most to the 2022 United States total expenditures is the $1,000,000 $4,999,999 class, with expenses of $149.1 billion, 32.9 percent of the United States total, up 22.1 percent from the 2021 level of $122.1 billion. The next highest is the $5,000,000 and over class with $130.8 billion, up 11.8 percent from $116.9 billion in 2021.”
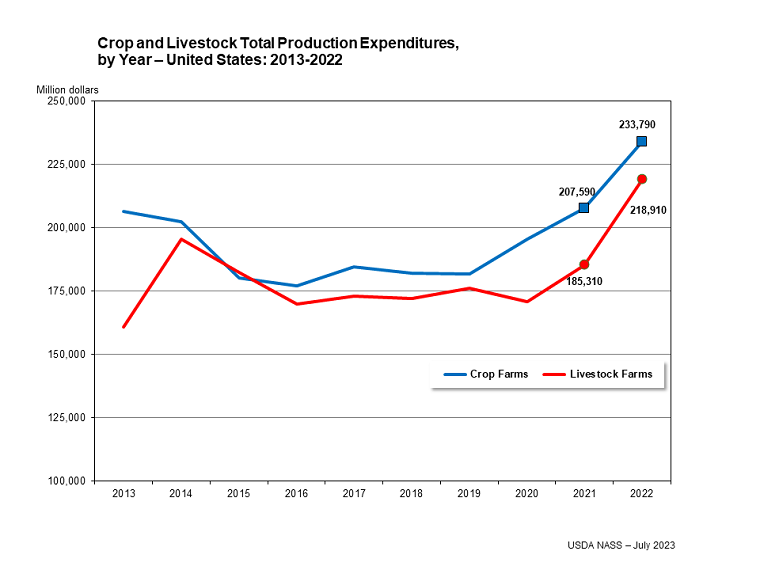
The NASS annual update added that, “In 2022, crop farms expenditures increased to $233.8 billion, up 12.6 percent, while livestock farms expenditures increased to $218.9 billion, up 18.1 percent.
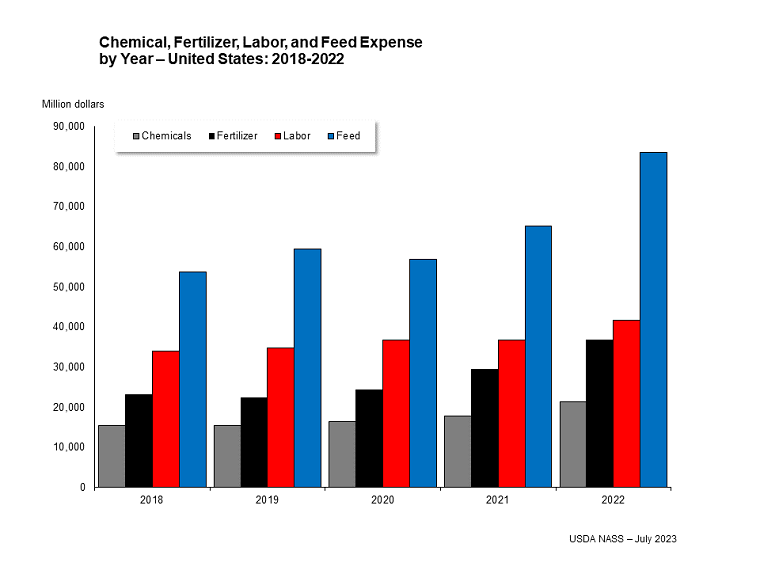
“The largest expenditures for crop farms are fertilizer, lime, and soil conditioners at $31.9 billion (13.6 percent), labor at $29.0 billon (12.4 percent), farm services at $28.6 billion (12.2 percent), and rent at $26.7 billion (11.4 percent). Combined crop inputs (chemicals, fertilizers, and seeds) are $73.4 billion, accounting for 31.4 percent of crop farms total expenses.
“The largest expenditures for livestock farms are feed at $81.0 billion (37.0 percent of total), livestock, poultry, and related expenses at $43.2 billion (19.7 percent), and farm services at $20.2 billion (9.2 percent). Together, these line items account for 66.0 percent of livestock farms total expenses. The average total expenditure for a crop farm is $259,246 compared to $200,359 per livestock farm.”
A separate NASS report from Iowa on Friday stated that, “Iowa farm production expenditures totaled $35.7 billion in 2022, according to the USDA, National Agricultural Statistics Service – Farm Production Expenditures 2022 Summary report. This was $1.70 billion above the 2021 total expenditures.”
Also on Friday, in its monthly Agricultural Prices report, NASS indicated that, “Fertilizer: The index for June, at 117.5, is down 0.6 percent from May and 23 percent from June a year ago. Since May, lower prices for mixed fertilizer and potash & phosphate more than offset higher prices for nitrogen.
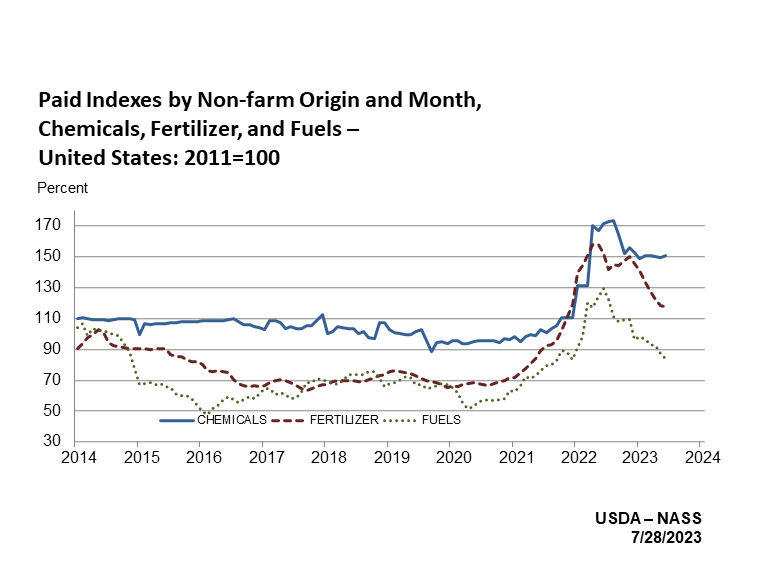
“Chemicals: The June index, at 150.6, is up 0.7 percent from May, but down 12 percent from last June.
“Fuels: At 83.9, the June index is down 3.7 percent from May and 35 percent from June 2022. Compared with May, prices are lower for LP gas and diesel but higher for gasoline.”
Also on Friday, Bloomberg writers Michael Hirtzer, and Tarso Veloso Ribeiro reported that,
One of the world’s largest tractor makers says it’s getting harder to pass on price increases to customers, in a sign of tightening conditions for farmers.
“Many farmers have been upgrading machines in the wake of Russia’s invasion of Ukraine in 2022 that disrupted grain exports and sent wheat prices to a record. But with harvests and prices normalizing while interest rates rise, farm profits are easing.
“‘We’ve been clear we have no intentions of decreasing pricing, but we think limiting how much we increase it is probably the right thing to do at this point,’ Scott Wine, the chief executive officer of farm and construction machinery manufacturer CNH Industrial NV, said in an interview Friday.”