


NOTUS’ Reese Gorman reported that, “House Speaker Mike Johnson and the White House are hoping to push a narrow reconciliation bill through the House by the end of next week…
USDA-RMA Report: Analysis of the Federal Crop Insurance Portfolio
Last week, the USDA’s Risk Management Agency (RMA) released an analysis of the Federal crop insurance portfolio titled, “The Risk Management Safety Net: Market Penetration and Market Potential.” Today’s update recaps some of the key findings from the RMA report.
The report explained that, “In 2016, crop insurance protected nearly $101 billion of crops and $533 million of livestock and was offered for nearly 550 unique crops and types.”
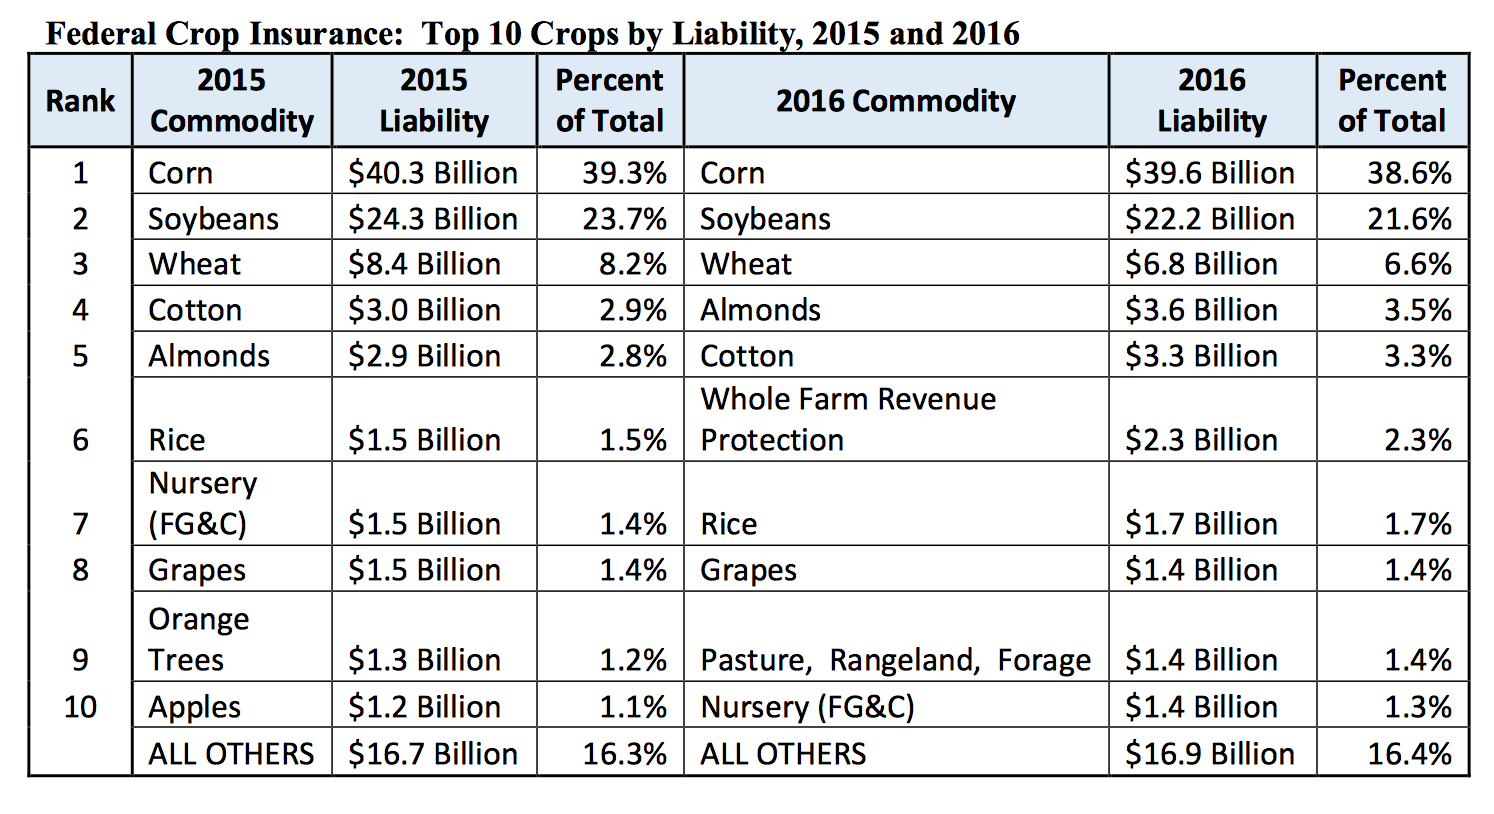
Corn, soybeans and wheat topped the list of insured commodities in both 2015 and 2016. Corn and soybeans together represented approximately 60 percent of the total liabilities in 2016. In addition, almonds had slightly more liability in the program ($3.6 billion) than cotton ($3.3 billion) in 2016.
The RMA report added that, “The predominant selection of risk management protection continues to be revenue products, with over 84 percent of total Federal crop insurance premium paid for individual revenue type policies in 2016.”

With respect to the perils that caused crop insurance related losses, RMA stated that, “Over the fifteen year period of 2001-2015, which included two serious drought years in the U.S., the following graphic shows the percentage of loss payments that were made for key perils that producers face.”

More specifically on program performance, last week’s report indicated that, “An industry standard measure of performance in insurance, the loss ratio, is total indemnity divided by total premium. It is used to measure the overall performance of the crop insurance program. This represents the amount of indemnity paid per dollar of premium collected. For example, a loss ratio of 0.90 means that for every dollar of premium collected, 90 cents was paid in indemnities.”
“[T]he loss ratio varies from year to year, primarily driven by lack of moisture or excess moisture,” the report said, adding that, “These weather extremes can be widespread when they occur, as was the case with the 2012 drought when significant crop damage resulted in a loss ratio in excess of 1.0. In other years, such as 2016, loss events are isolated, resulting in a loss ratio well below 1.0. Given the annual variation in loss ratios, program stability and actuarial soundness is measured based on the historical average.
The 20 year average loss ratio for the crop insurance program is 0.85, representing a financially stable and actuarially sound insurance program as required by the Federal Crop Insurance Act.

And on the issue of improper payments and crop insurance, RMA noted that, “The government provides a statistical measure of the amount of improper payments made for government programs as a quality measurement to assure the prudent use of taxpayer dollars. The Risk Management Agency has been diligent in identifying areas that needed additional internal controls to prevent improper payments, resulting in a statistically measured improper payment rate of 2.02 percent in 2016, less than half of the 4.08 percent from 2012. [Note: For background on recent developments regarding SNAP program (food stamps) improper payment issues, see this FarmPolicyNews update from September 15].

Meanwhile, while addressing organic commodity production, the RMA report pointed out that, “Organic commodity insurance has also increased over time. The following tables show the top 10 crops with the largest amounts of organic liability for 2011 and 2015.”

Also, last week’s report explained that:
Efforts to improve market penetration for the principal crops have been very successful with nearly 89 percent of all acres insured in 2015, up 4 percent, or nearly 8.7 million acres, from 2011 and up 15 percent, or nearly 35.5 million acres, from 2000.
“These increases were in barley, grain sorghum, peanuts, rice, soybean, and tobacco acres. Insured acres increased more than U.S. expansion of crop acres in most cases.”
“Early in the history of the Federal crop insurance program, the majority of efforts to improve market penetration were focused on these principal crops because they are widely grown in the U.S.,” the report said. “In the mid 1990’s, public policy was directed successfully to encourage participation in Federal crop insurance to avoid the need for ad-hoc disaster assistance.”

The report added that, “RMA continues to communicate with stakeholders to identify new commodities or expansion of existing commodities that need risk management protection. RMA will also continue to work with stakeholders and monitor existing plans of insurance to identify issues or modifications needed, or whether new types of coverage should be added for the ever-changing agricultural landscape.”