Beef prices are projected to continue increasing as U.S. beef production declines with no signs of a cattle herd rebuild. Additionally, cheap beef may soon become further out of reach…
Iowa State University- “Financial stress in Iowa farms: 2014-2016”
Iowa State University (ISU) Extension Economist Alejandro Plastina penned a recent article titled, “Financial Stress in Iowa Farms: 2014-2016.” Today’s update recaps some of the key findings from the ISU article.
The article explained that, “Iowa farm financial conditions have deteriorated since 2012, but average indicators of liquidity and solvency remain close to their long-term levels. However, average financial measures mask the variability across farms. This article tracks the evolution of financial stress in Iowa farms using a panel of financial statements for 273 farms collected by the Iowa Farm Business Association (IFBA)”
The ISU update noted that, “Average accrued net farm income in Iowa declined by 89 percent from its peak of $243,072 in 2012 to $27,927 in 2015, before recovering slightly to $45,597 in 2016 (Figure 1).”
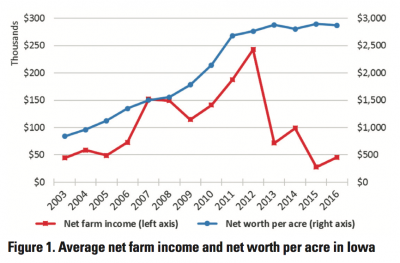
Dr. Plastina indicated that, “As a consequence of this erosion in farm profitability, a deterioration of the overall financial health of the farm sector ensued. Relative measures of solvency (such as the debt-to-asset ratio) and liquidity (such as the current ratio) have deteriorated rapidly since 2012, and are now close to their 2006 levels (Figure 2). However, average net worth per acre has remained stable at around $2,750 since 2011 (Figure 1).”
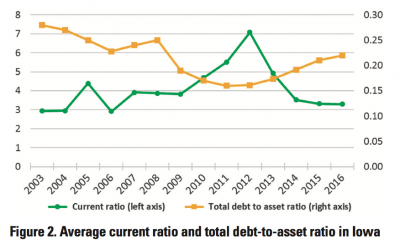
The article noted that, “Although state averages show to some extent the recent deterioration of farm financial conditions, they also seem to indicate that the liquidity and solvency situations as of December 2016 are similar to their pre-2010 levels, when far fewer editorials about financially stressed farms made news.”
After discussing some details of the data used in the analysis, Dr. Plastina turned to liquidity issues and pointed out that, “According to the Farm Financial Scorecard, a CR [the current ratio, calculated as current assets divided by current liabilities] above 2.0 indicates a strong liquidity position; a ratio below 1.3 indicates a vulnerable liquidity position, and a ratio between 1.3 and 2.0 is normal and indicates that liquidity should be kept under close watch.”
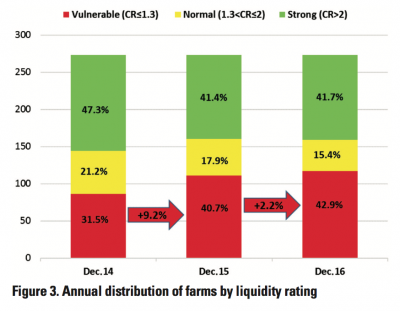
The update noted that, “In December 2014, almost half (47.3 percent) of the farms had a strong liquidity rating and less than one third (31.5 percent) of the farms had a vulnerable liquidity rating (Figure 3). By December 2015, the percent of farms with vulnerable liquidity ratings increased by 9.2 percentage points and vulnerable farms accounted for about the same share as farms with strong liquidity ratings: 40.7 percent versus 41.4 percent. By December 2016, there were more farms with vulnerable liquidity ratings than farms with strong liquidity ratings, representing 42.9 percent versus 41.7 percent of the sample, respectively.
More than two in five farms run the risk of not being able to pay off their obligations as they become due over the course of 2017.
The paper then highlighted changes in solvency and noted that, “To ensure the comparability of financial solvency across farms of different sizes, the assessment is conducted using the debt- to-asset ratio [DTA], calculated as total farm liabilities divided by total farm assets.”
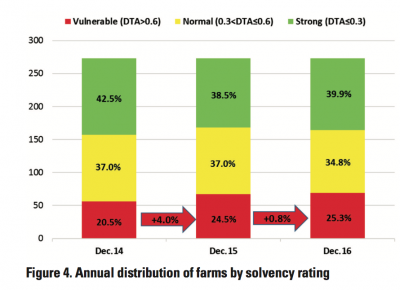
Dr. Plastina stated that, “In December 2014, only one in five farms (20.5 percent) was assigned a vulnerable solvency rating (Figure 4). But a year later, almost one in four farms (24.5 percent) had a vulnerable solvency rating. By December 2016, slightly more than one in four farms was highly leveraged.
By comparing Figures 3 and 4 it becomes apparent that solvency issues are much less prevalent than liquidity issues.
“However, it must be noted that machinery, land, and other long-lived assets are valued at their cost (or book) value and therefore do not reflect the recent decline in asset values.”
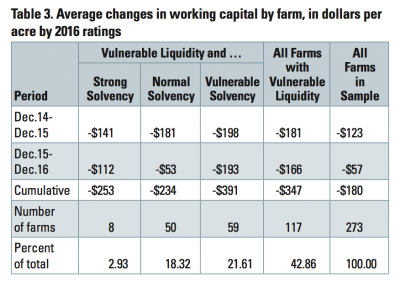
And while addressing working capital per acre [the dollar amount of current assets minus current liabilities divided by the number of acres in the operation], the ISU paper explained that, “The average loss in working capital across all farms in the sample amounted to $123 per acre in 2015 and $57 per acre in 2016, accumulating a $180 loss over the entire period (Table 3). But farms with vulnerable liquidity ratings in December 2016 accumulated an average loss in working capital of $347 per acre. Even a few farms with strong solvency ratings had vulnerable liquidity ratings in December 2016, and they had accumulated a working capital loss of $253 per acre.”
In summary, Dr. Plastina indicated that,
The share of financially stressed farms (vulnerable liquidity or solvency ratings) increased from 38 percent in December 2014 to 47 percent in December 2016.
“On average, farms lost $180 per acre of working capital over that period, but farms with vulnerable liquidity ratings lost almost twice that amount.”


