Bloomberg's Leah Nylen reported Thursday that "a Colorado judge issued an order temporarily blocking the proposed $25 billion merger of Kroger Co. and Albertsons Cos., which has been challenged by…
Recent USDA Updates Provide Snapshot of Farm Economy Variables
Last week, USDA’s National Agricultural Statistics Service (NASS) released three important updates that provide current insight into the state of the U.S. agricultural economy. The releases focused on land values, cash rents, and production expenditures.
Meanwhile, USDA’s Economic Research Service (ERS) recently updated its monthly agricultural trade data, and on Monday, included an article related to farm household income in its Amber Waves magazine publication.
As lawmakers and the executive branch continue to gather perspective in preparation for the next Farm Bill, today’s post looks briefly at some of the key findings from these recent USDA updates on the farm economy.
NASS- Land Values, Cash Rents, Production Expenditures
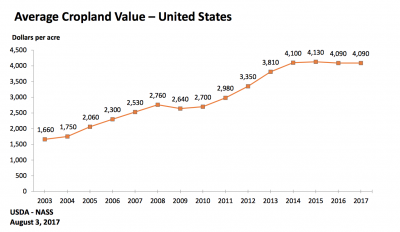
In its annual Land Values summary from Thursday, NASS indicated that, “The United States cropland value remained unchanged at $4,090 per acre from the previous year. In the Southern Plains region, the average cropland value increased 6.0 percent from the previous year. However, in the Northern Plains region, cropland values decreased by 4.4 percent.”
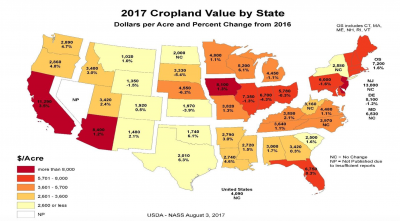
The NASS update also included this more detailed state-by-state graphical look at changes in average cropland values from 2016.
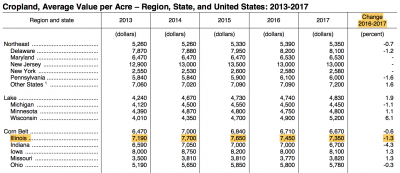
More specific to Illinois, Thursday’s report included this table which indicated that Illinois land values in 2017 averaged $7,350, down 1.3 percent from 2016. In 2014, the average value was $7,700.
Also on Thursday, NASS updated its Quick Stats Database for Cash Rents.
A news update from the NASS Iowa Field Office last week indicated that, “Cropland cash rent paid to Iowa landlords in 2017 averaged $231.00 per acre.”
This represented a decline from $260 in 2014, $250 in 2015, and $235 from last year.

A Great Lakes Region news update from NASS on Friday stated that, “Indiana’s cropland cash rent was $195.00 per acre in 2017, up $3.00 from the previous year. Cropland cash rents in the Corn Belt region decreased $1.00 from last year to $201.00 per acre.”
And in Illinois, cash rents for cropland was $218 in 2017, down from $220 in 2016, and from $228 in 2015.
"Cash Farmland Rents Down a Little Bit from Last Year," https://t.co/fJ7XaF3CvH (MP3- 1 minute), @USDA radio
— Farm Policy (@FarmPolicy) August 6, 2017
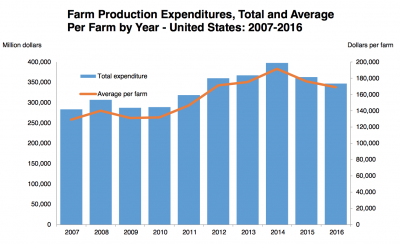
With respect to production expenses, NASS released its Farm Production Expenditures 2016 Summary on Thursday as well.
The report stated that, “Farm Production Expenditures in the United States are estimated at $346.9 billion for 2016, down from $362.8 billion in 2015.”
The report added that, “In 2016, the United States total farm expenditure average per farm is $169,035, down 4.1 percent from $176,181 in 2015.”
ERS- Trade Data, Agricultural Marketing Service Overview
Late last week, and yesterday, ERS updated a portion of its monthly trade related data. In a summary of some of the data, Gary Crawford of USDA radio explained yesterday that, “We only have complete trade figures for the fist nine months of this fiscal year, October through June, but during that time the U.S. farm and food sector has racked up a pretty good trade surplus, just over $19 billion.”
A positive U.S. balance for agricultural trade in June, https://t.co/IsMm12AzBA (@USDA_ERS) pic.twitter.com/ZayxB1AZEu
— Farm Policy (@FarmPolicy) August 4, 2017
Agriculture Department analyst Bryce Cooke explained on the radio segment that, “[The trade surplus] is significantly larger than the trade surplus to date last year at this time, which was $10.9 billion.”
Updated data on U.S. ag exports, #wheat, #corn, #soybeans https://t.co/OB5u8BXM0h, @USDA_ERS pic.twitter.com/VyL4hDroA6
— Farm Policy (@FarmPolicy) August 7, 2017
Mr. Crawford added that, “The value of wheat exports up by 33 percent, corn 28, soybeans 26, [and] cotton a remarkable 93 percent.”
Also yesterday, The Economic Landscape, a monthly publication from the USDA’s Agricultural Marketing Service, indicated that, “Compared to June 2016, beef and veal exports (including variety meats) increased 11 percent to 110 thousand MT and the export value rose 10 percent to $603 million. The export volume and value were respectively 4 and 3 percent higher than in May. The first half of the year beef export volume rose 12 percent from last year, and was up 15 percent in value. Japan, South Korea and Canada were our largest export markets in June.”
In a related item, Alan Rappeport reported yesterday at The New York Times Online that, “One accomplishment that Mr. Trump has notched on trade has been an agreement with China that opened its market to American beef exports. For the beef industry, however, the benefits of that deal pale in comparison with the cost of abandoning the Trans-Pacific Partnership, which had been spearheaded by President Barack Obama. It would have provided access to the enormous Japanese market.
“Instead, Japanese tariffs on American frozen beef, which would have declined under Mr. Obama’s deal, are on the rise. Last week, they increased to 50 percent from 38 percent, making America’s meat even more vulnerable to competition from countries such as Australia.
“‘TPP was fantastic,’ said Kent Bacus director of international trade for the National Cattlemen’s Beef Association. ‘When you walk away from it without a meaningful alternative, that causes a lot of alarm in the beef industry.'”
Farm Household Income
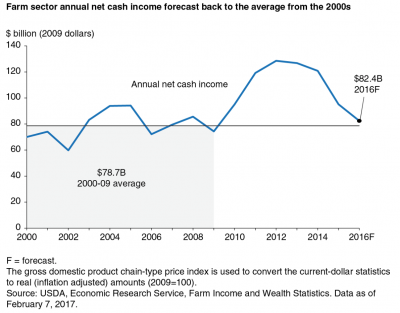
Lastly today, ERS indicated yesterday in an Amber Waves magazine article (“Examining Farm Sector and Farm Household Income“) that, “After adjusting for inflation, the decline in net cash income from 2013 to the ERS forecast for 2016 would be the largest decline since the 1980s in both absolute ($44 billion) and percentage (35 percent) terms. Prices received by farmers for all major commodities are lower, with many (such as corn, wheat, and milk) down 30 percent or more from highs recorded just a few years earlier. The recent declines in net cash income for the farm sector are large in percentage terms. But, when viewed over a longer time horizon and after adjusting for inflation, net cash income is forecast to return to the levels observed before this record growth. In 2016, net cash income is forecast nearly $4 billion (or about 5 percent) higher than the average net cash income from 2000 to 2009.”
Note that ERS will update its Farm Income Forecast later this month.


