Bloomberg's Clarice Couto reported this past Friday that "a surprising tax change in agriculture powerhouse Brazil has the potential to make soy grown in the world’s largest bean exporter less…
Quick Take: Recent USDA Trade Data
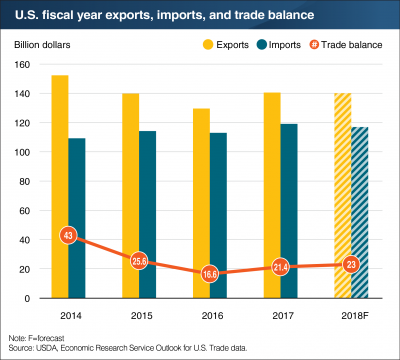
Over the past several days, the U.S. Department of Agriculture has released a handful of updates relating to U.S. agricultural trade. The recent information includes updated projections for fiscal year 2018 agricultural exports, as well as the latest monthly trade data. As trade policy uncertainty persists, today’s post provides a brief overview of the recent trade information.
The USDA’s Foreign Agricultural Service (FAS) and Economic Research Service (ERS) updated the Department’s joint Quarterly Agricultural Export Forecast on May 31st.
The report (“Outlook for U.S. Agricultural Trade“), stated that, “Fiscal year 2018 agricultural exports are projected at $142.5 billion, up $3.0 billion from the February forecast, primarily due to expected increases in corn and cotton exports.
Corn is forecast up $1.3 billion to $10.3 billion on both larger volumes and higher unit values, as weather-reduced crop prospects in South America improve U.S. export opportunities into the summer.
The trade update added that, “Oilseed and product exports are forecast at $31.5 billion, up $400 million from the February forecast, mainly on increased trade of soybean products. Soybean prices have risen sharply in response to crop losses in Argentina, but export volumes are down due to slower exports to China, which will bring total soybean exports down $100 million to $21.9 billion. On the other hand, soybean meal and oil exports are up due to lower competition from Argentina. Meal is up on both higher volumes and unit prices, while soybean oil is up on higher volumes only.”

Meanwhile, a report on Thursday from USDA radio noted that recent trade data through the first seven months of the fiscal year (October – April) demonstrated that U.S. agricultural exports for April were the highest since 2014. The total value of U.S. agricultural exports so far this fiscal year is $86.8 billion, which was only about two percent less than for the same seven month period in 2017.
U.S. #Agricutlural #Trade Update, https://t.co/vNTpW3v2H5 @USDA_ERS pic.twitter.com/kVB6BokRMT
— Farm Policy (@FarmPolicy) June 6, 2018
The new data also showed that export sales of soybeans are off by eighteen percent from a year ago, while wheat and corn exports are down fourteen percent and nine percent from last year, respectively.
U.S. #agricultural exports, year-to-date and current months by value- #soybeans, #corn and #wheat https://t.co/cURBGp3QpY @USDA_ERS pic.twitter.com/xczAkFWNFS
— Farm Policy (@FarmPolicy) June 8, 2018
By volume, soybean exports to China for April of this year were down by about forty percent from April of 2017.
Top 10 U.S. export markets for #soybeans by volume, https://t.co/thW9FO1Ol7 @USDA_ERS pic.twitter.com/2yKcSfaUIc
— Farm Policy (@FarmPolicy) June 7, 2018
And the volume of corn exported to Mexico was up by about fourteen percent this April compared to last year.
Top 10 U.S. export markets for #corn, by volume https://t.co/eguICAUD3W @USDA_ERS pic.twitter.com/JipsBlfQ4b
— Farm Policy (@FarmPolicy) June 7, 2018
In a closer look at livestock exports, USDA’s Agricultural Marketing Service (AMS) stated in The Economic Landscape for June that, “Pork exports in April (including variety meats) were 13 percent higher than in 2017 at 225 thousand MT, and the value was up 11 percent to $551 million. Pork export volume added 1 percent from March while the value was down 4 percent. For 2018 so far, pork exports are up from 2017 by 4 percent in volume and 7 percent in value. The largest overseas markets for U.S. pork were Japan, South Korea and Mexico.”
On beef exports, AMS indicated that, “Compared to April 2017, beef and veal exports (including variety meats) increased 11 percent to 111 thousand MT, and the export value rose 23 percent to $677 million. The export volume and value were down 1 and 2 percent, respectively, from March. Cumulative beef exports were higher in volume by 10 percent relative to 2017, and value was 20 percent higher. Japan, South Korea and Mexico were our largest export markets in April.”
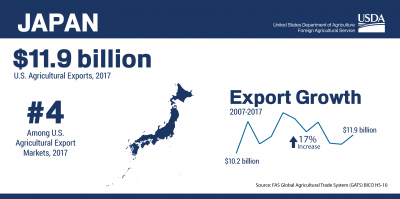
And last month, FAS released a report more narrowly focused on Japan (“United States Agricultural Exports to Japan Remain Promising“) which stated that, “Japan is the second largest export market for U.S. corn in the world. Given the absence of significant corn production in Japan, imports are projected to remain strong. In 2017, the United States exported nearly $2.2 billion of corn to Japan, approximately 24 percent of total U.S. corn exports to the world by value. The top U.S. competitor in the Japanese market is Brazil.”

The FAS update added, “Following a two year-long analysis of U.S. ethanol’s carbon intensity, in 2018 Japan adopted a standard that opens the door to 366 million liters (nearly 100 million gallons) of U.S. corn-based bio-ethanol (estimated value $170 million per year). Japan requires 824 million liters of ethanol annually to be blended as a fuel oxygenate in its gasoline supply. Until this revision, Brazilian sugarcane-based ethanol had been the only source of ethanol that met Japan’s requirements for low carbon fuel.”
Regarding pork, the FAS report explained that, “In 2017, Japan ranked as the largest global importer of pork and pork products. Japanese pork imports from the world grew 6 percent, from $4.9 billion in 2016 to $5.2 billion in 2017. Japan’s top imported pork products are frozen pork and fresh/chilled pork. For over a decade, the United States was the top pork supplier to Japan. In 2017, however, the EU matched U.S. market share at 33 percent market share, followed by Canada (21 percent), and Mexico (8 percent) and Chile (2 percent). Japan is highly protective of its pork industry and has excluded pork completely or included only provided minor tariff reductions and small tariff-rate quotas in previous bilateral trade agreements. However, the Japan-EU agreement marks a change with Japan eliminating tariffs on more than 60 percent of its pork and pork product tariff lines within 12 years. For more information, please see IATR: Japan-EU Trade Agreement Threatens U.S. Pork Exports to Japan.”


