Bloomberg's Leah Nylen reported Thursday that "a Colorado judge issued an order temporarily blocking the proposed $25 billion merger of Kroger Co. and Albertsons Cos., which has been challenged by…
The 2020 Outlook for U.S. Agriculture From USDA’s Chief Economist
Speaking on Thursday at USDA’s Agricultural Outlook Forum in Arlington, Virginia, USDA Chief Economist Robert C. Johansson provided a broad outlook for U.S. agriculture. Today’s update provides an overview of key aspects of Dr. Johansson’s presentation.
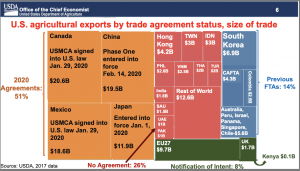
In his speech Thursday (transcript / slides), Dr. Johansson noted that, “Despite mixed signals heading into 2020, there has been important progress on the trade policy front over the past year and significant improvements in market access for U.S. agriculture in 2020. The U.S.-Mexico-Canada Agreement (USMCA) was signed into law last month and once the agreement enters into force, agricultural producers in all three countries will benefit from even stronger integration and science-based trading rules. The U.S.-Japan Agreement eliminates or reduces tariffs on $7.2 billion in U.S. agricultural and food products, and importantly U.S. beef and pork exports now have the same preferential access to Japan’s $5 trillion economy as competitors such as the EU, Australia, New Zealand, and Canada, which have increased exports and market share over the past year. Lastly, the United States and China reached an agreement that addresses many long-standing agricultural barriers to China’s market and expands U.S. agricultural exports over the next two years.
“Those three trade deals alone cover over half of U.S. agricultural exports.”
Dr. Johansson indicated that, “As China’s economy grew and became more open as a result of joining the WTO in 2001, U.S. exports also grew. In contrast, U.S. exports to India have increased slowly relative to China. However, fiscal 2019 exports to India reached a high of $1.8 billion and ongoing bilateral engagement is aimed at addressing trade barriers that have hindered U.S. market access.”
The evolution of US agricultural exports, and look for the red bubble (China) to see the huge jump in exports over the last 20 years, and the big drop in 2019 | #OATT #USDAOutlook #TradeWar pic.twitter.com/VyKW5QLfE5
— Javier Blas (@JavierBlas) February 20, 2020
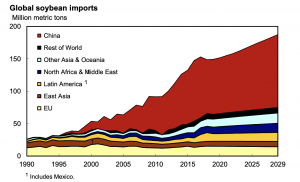
More narrowly, Dr. Johansson explained that, “Global soybean trade is projected to increase by 36 million tons (24 percent), reaching 187 million tons by 2029/30.
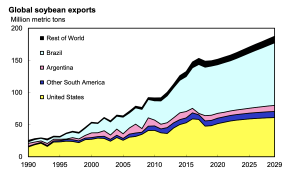
“China’s soybean imports account for 74 percent of this projected increase and China remains the world’s predominant importer of soybeans.”
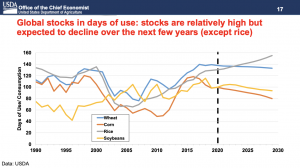
Turing to commodity supply and demand variables, Dr. Johansson stated that, “Taking a look at the global stocks to use, we do see slightly lower stocks relative to demand (measured in days of use) after the poor production year in 2019, which suggest better returns for corn and soybeans relative to wheat, cotton and rice. Still, stock levels for those crops sit at roughly the same levels we saw back in the early 2000s when prices were quite low.”
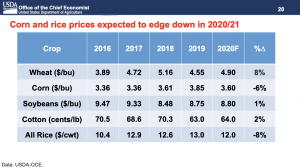
And, in a look at soybean and corn price prospects, Dr. Johansson indicated that, “Under the expectation of a return to normal trade with our major trading partners, with some growth in those markets boosted by trade agreements, we project that soybean prices will rise modestly, up $0.05 to $8.80 per bushel. The soybean price will be supported by lower stocks compared to last year’s record level, but increased South American production and exports, as well as a strong dollar, will weigh on the market. In contrast, corn is expected to decline $0.25 cents to $3.60 per bushel, with larger corn acres and an expected return to trend yields following last year’s adverse planting weather.”
While addressing farm income variables, Dr. Johansson pointed out that, “More than 98 percent of farms in America are family farms, so farm household income is a good benchmark for the sector overall, with family members in many farm households working off the farm to provide for health care and to contribute to the overall household income stream. From this figure, we can see that overall, farm household income stretches from -$8,000 to more than $300,000, with the median at roughly $72,000 – typically above the median U.S. household income. This is down slightly from 2019, with lower net cash income expected from on-farm activities.”
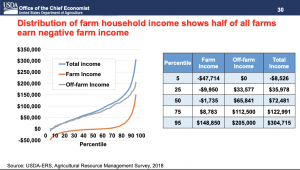
“A growing U.S. economy helps farm household income but falling commodity prices in recent years for a host of reasons have weighed on farm income. Farm income has rebounded slightly since 2016, in part due to the high levels of prevent-plant payments in 2019, ad hoc disaster assistance in several years, and the trade mitigation programs in 2018 and 2019. Some of that assistance will be paid out to producers in 2020 and will help offset the adverse impacts of disasters on the one hand and trade adjustments on the other.”

In a closer look at farm financial variables, Dr. Johansson stated that, “For this year, farm sector debt is forecast at $425 billion with $265 billion in real estate debt— including loans using real estate as collateral—and $161 billion in non-real estate debt. Overall farm sector debt is near its peak in the early 1980s. Accounting for inflation, equity is forecast to decrease 0.7 percent in 2020 compared the previous year, while debt is anticipated to increase 0.5%. That puts the debt-to-asset ratio for the farm sector at 13.59 for 2020, still low, but the highest level since 2003 and passing the levels seen during the Great Recession. However, both interest rates and inflation are expected to remain low, which has kept debt financing costs low and which also has helped maintain equity in high farmland values. We expect a continued strengthening in debt repayment capacity in 2020, offsetting the worry that farm debt is becoming broadly unmanageable.”

With respect to farm bankruptcies, the Chief Economist explained that, “The overall farm bankruptcy rate for the U.S., it has remained below 3 farms per 10,000 over the past 9 years, and while it has increased by 24 percent this past year, the rate is much lower than it was twenty years ago.
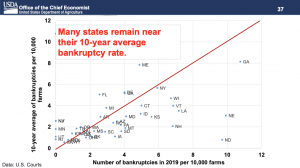
“If we look at individual states, there are some that will show higher than average bankruptcy rates, such as Georgia, Nebraska, and North Dakota, but there are others where the bankruptcy rates have been lower than average.”


