


Senate Agriculture Chair John Boozman said Monday he plans to soon take up a five-year farm bill, regardless of delays a similar bill may face in the House. Asked at…
La Nina, A “Supply-Side Wild Card,” Could Impact Markets Into 2021
Wall Street Journal writer Lucy Craymer reported late last week that, “La Niña is shaking up agriculture in an already-tumultuous year for commodity markets.
“The natural weather phenomenon, known as the cool sister of the better-known El Niño, occurs every few years. It is characterized by cooler-than-normal waters in the Pacific Ocean, causing dry weather in some parts of the globe and heavy rainfall in others.
“Past La Niñas have created significant market volatility and raised prices for many foods, and the current edition is already pushing up prices of crops such as corn and reducing supplies of pineapples and mangos. This event has the potential to last till the Northern Hemisphere spring, according to government forecasters in the U.S., Japan and Australia who monitor sea conditions.”
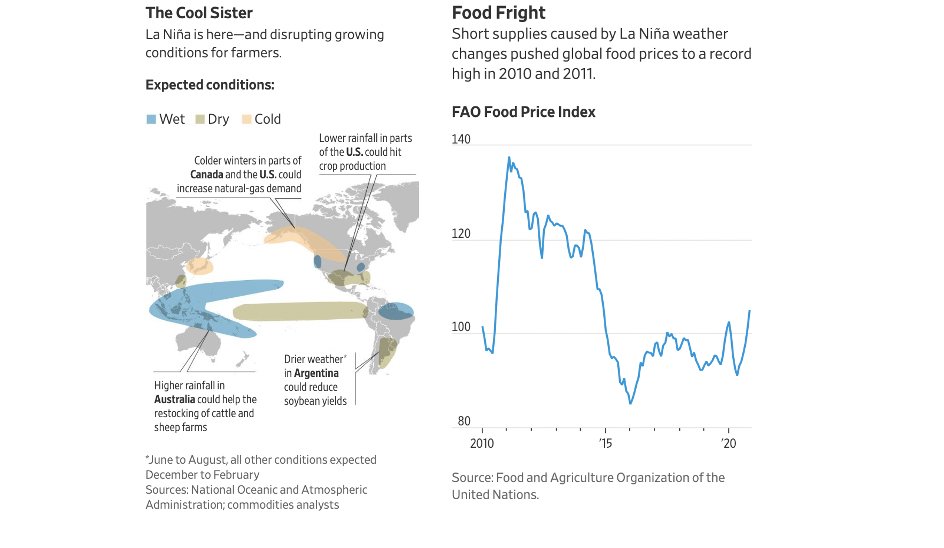
The Journal article pointed out that, “So far, dry conditions have been reported in Brazil, Argentina, and parts of the U.S., and bouts of excessive rain in Australia and parts of Southeast Asia.
‘La Niña 2020 has evolved quicker and with stronger intensity than many leading climate models predicted,’ analysts from J.P. Morgan said in November, calling the phenomenon the ‘primary supply-side wild card’ for agricultural markets going into 2021.
Ms. Craymer explained that, “Prices of some U.S. crops have climbed this year, thanks in part to increased demand from China and a pandemic fueled baking craze. Futures prices for soybeans, corn and hard red winter wheat—the kind used in bread—have risen by as much as a third since a rally began on Aug. 10.”

The Journal article added that, “The last La Niña formed in November 2017 and lasted till April 2018. The biggest recent La Niña impact on the global food market came when one developed in July 2010, lasted through May 2011, and was followed by another later that year. The United Nations Food and Agriculture food price index—which includes globally traded commodities including meat, grains and dairy—hit a record high in 2011.
“In November, that index was near a six-year high.”
2. Latest 30 day % of normal precip map for SA. Recent rains have done a lot to eliminate deficits in driest areas of southern Brazil. But deficits creeping up in central west Brazil. Important to watch if forecast rains in next couple of weeks materialize. pic.twitter.com/9lVpTrPsyc
— Scott Irwin (@ScottIrwinUI) December 7, 2020
More specifically on food prices, Reuters News reported last week that, “World food prices rose for a sixth month running in November, hitting almost a six year high with the index posting its biggest monthly increase since July 2012, the United Nations food agency said on Thursday.
“The Food and Agriculture Organization’s food price index, which measures monthly changes for a basket of cereals, oilseeds, dairy products, meat and sugar, averaged 105.0 points last month, versus a slightly revised 101.0 in October.
“The October figure was previously given as 100.9.”

The Reuters article added that, “The forecast for world cereal stocks by the close of seasons in 2021 was 866.4 million tonnes, down 9.6 million tonnes from the previous estimate posted last month.
“‘At this level, the global cereal stock-to-use ratio would decline from 31.8 percent in 2019/20 to 30.7 percent in 2020/21, a five-year low but still a relatively comfortable level,’ FAO said.”