Season-average price estimates for wheat, corn, soybeans, soybean meal, cheese and cotton were all raised slightly in the Agriculture Department’s latest World Agricultural Supply and Demand Estimates (WASDE) report published…
2017 U.S. Farm Income Forecast- November Update
On Wednesday, the USDA’s Economic Research Service (ERS) released its November 2017 Farm Income Forecast. This follows the August revision of the initial net farm income forecast released by ERS in February. The USDA will release one more revision of the 2017 net farm income forecast in February 2018, and the 2017 official estimates will be released in August 2018. Today’s update provides a recap of highlights from the farm income forecast.
Wednesday’s update noted that, “After 3 consecutive years of decline, farm sector profits are forecast to be relatively stable in 2017.”

“Net farm income, a broader measure of profits, is forecast to increase $1.7 billion (2.7 percent) from 2016 to $63.2 billion in 2017 and net cash income is forecast to increase $3.7 billion (3.9 percent) to $96.9 billion, in nominal terms. Inflation-adjusted net farm income is forecast to be relatively unchanged from 2016, while inflation adjusted net cash farm income is forecast to rise 2.1 percent.”
The ERS update stated that, “The value of agricultural sector production is composed primarily of crop and livestock cash receipts, adjusted for any changes in the value of inventories and home consumption plus farm-related income.
The value of U.S. agricultural sector production is expected to rise $8.7 billion (2.2 percent) in 2017 to $407.8 billion. An $11.3-billion (6.9 percent) increase expected for the value of animals/animal products and a $3.3-billion increase in farm-related income more than offset a predicted $5.9-billion (3.1 percent) decrease in the value of crop production

More narrowly, ERS noted that, “Corn receipts are expected to decline $0.2 billion (0.5 percent) in 2017 (dropping for the fifth consecutive year) as the U.S. average corn price is expected to drop from 2016 to 2017…[and]…lower soybean receipts ($3.2 billion or 7.6 percent) in 2017 reflect a decline in quantity sold more than offsetting higher soybean prices.”

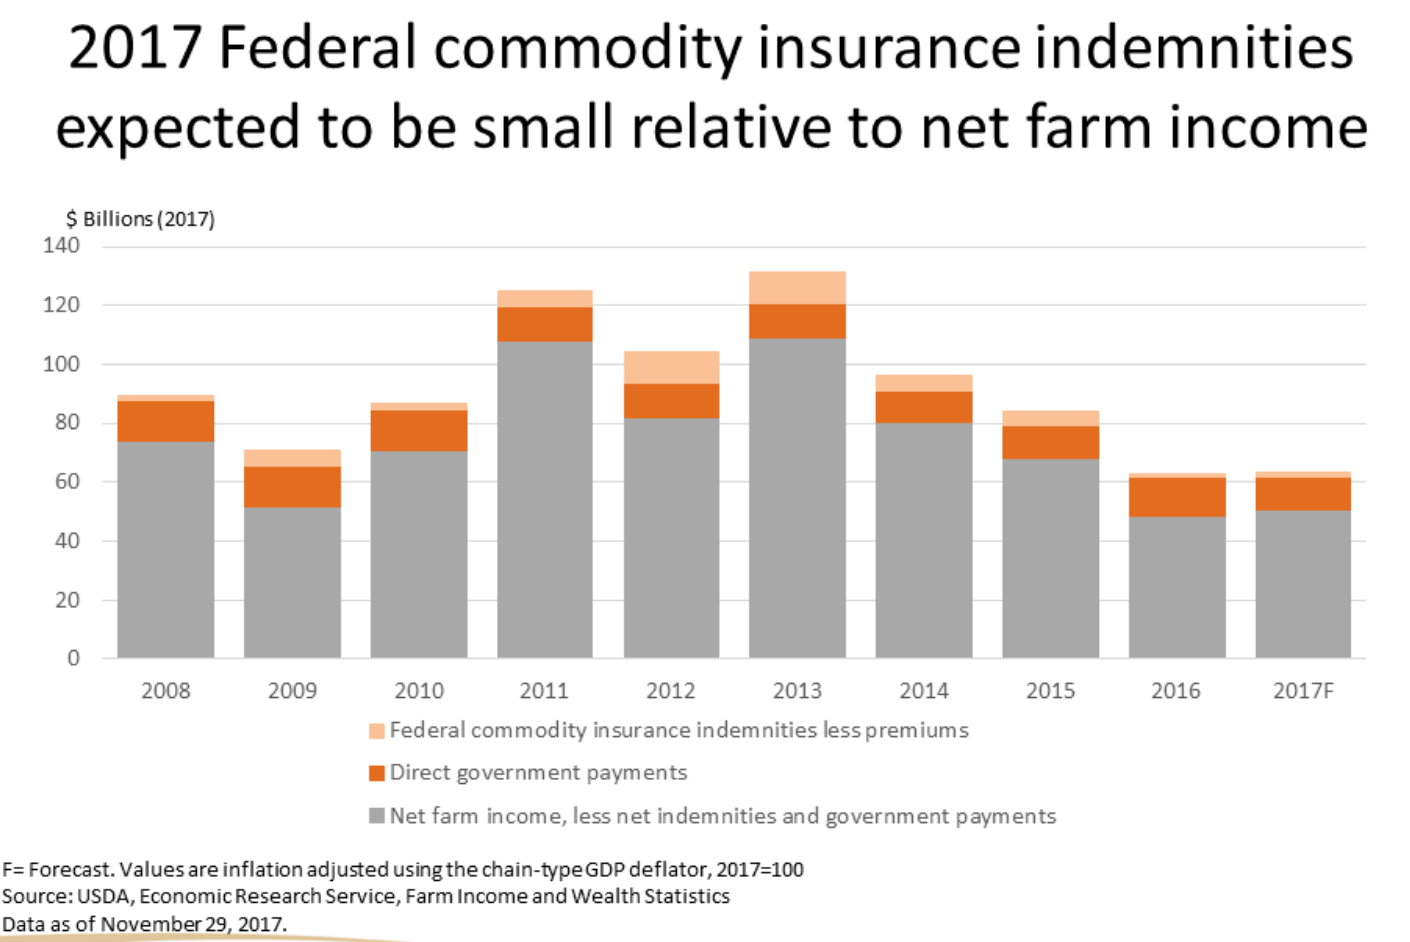
While addressing Federal government support for agriculture, ERS indicated that, “Direct government farm program payments are those made ‘directly’ by the Federal Government to farmers and ranchers without any intermediaries. They include payments from the programs created in the 2014 Farm Bill, as well as a few other programs, but do not include FCIC insurance indemnity payments or USDA loans.
Direct government farm program payments are forecast to decline almost 14 percent in 2017 from 2016.

Within the context of Federal payments, ERS explained that, “The increase in PLC [Price Loss Coverage] payments from $1.9 billion in 2016 to $3.1 billion in 2017 mostly reflects increases in wheat PLC payments, followed by increases in payments for corn, grain sorghum, and long-grain rice. No PLC payments were made for soybeans in 2016 and none are expected for 2017.
“ARC [Agricultural Risk Coverage] payments, forecast to be $3.7 billion in 2017, are expected to decline almost $2.4 billion from 2016. Corn ARC payments are expected to decline about $1.3 billion, followed by an almost $0.9-billion decline in soybean payments. Corn payments, which accounted for about 60 percent of 2016 ARC payments, are expected to account for about 75 percent of 2017 ARC payments.”
On the cost side of the equation, ERS pointed out that, “After reaching record highs exceeding $390 billion in 2014, farm sector production expenses (including operator dwellings) declined by more than $40 billion the next 2 years. Following a total of $350 billion in 2016, 2017 production expenses are forecast higher at $356 billion.”

And in a look at farm household income, ERS stated that, “Median farm income earned by farm households is estimated at -$940 in 2016 and is forecast at -$1,093 in 2017. In recent years, slightly more than half of farm households have lost money on their farming operations each year. Most of these households earn positive off-farm income—and median off-farm income is forecast to increase 2.3 percent, from $66,468 in 2016 to $67,973 in 2017.”

The ERS update also included information on farm sector solvency and liquidity, and stated that, “The farm sector debt-to-asset ratio and debt-to-equity ratios are expected to move slightly upward, and the equity-to-asset ratio is expected to decline slightly in 2017.”

“Liquidity ratios have weakened over the past several years. Working capital, which is the difference between current assets and current liabilities, is forecast at $65.3 billion in 2017, after averaging $114.4 billion from 2009 to 2016. The ‘current ratio,’ which is current assets divided by current debt and is another measure of liquidity, averaged 2.26 during 2009-16. However, it too is forecast down to 1.57 in 2017, after trending downward since 2012.”
Related News Summaries