Beef prices are projected to continue increasing as U.S. beef production declines with no signs of a cattle herd rebuild. Additionally, cheap beef may soon become further out of reach…
2017 U.S. Farm Income Forecast Updated
Yesterday, the USDA’s Economic Research Service (ERS) released its August 2017 Farm Income Forecast. This was the first revision of the initial net farm income forecast released by ERS in February. Today’s update provides a recap of highlights from the farm income forecast. As the discussion over the next Farm Bill continues, the ERS update provides an important reference point regarding the current status of the U.S. farm economy.
August 2017 Farm Income Forecast, USDA-ERS
Benjamin Parkin reported yesterday at The Wall Street Journal Online that, “U.S. farm incomes will rise in 2017, halting three consecutive years of decline, as a slump in crop and animal prices eases.
The U.S. Department of Agriculture said net farm income will rise to $63.4 billion, up 3% from a year earlier but still just about half of 2013’s record $124 billion.
“Rising profits are a relief to many farmers squeezed by the multiyear slump in the agricultural economy. Analysts nevertheless expect a continuing grain glut to pressure prices this year, with forecasts showing another year of bumper U.S. corn and soybean harvests after those crops appeared to recover from early weather troubles. Meanwhile, rising production in countries like Brazil and Russia is adding to global stockpiles.”
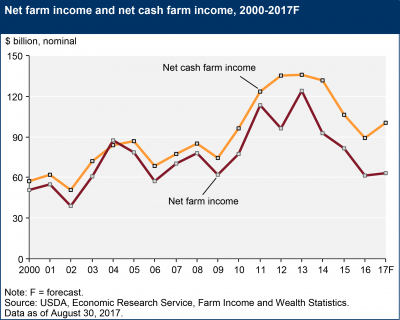
Yesterday’s ERS report stated that, “The annual value of U.S. agricultural sector production is expected to rise $6.5 billion (1.6 percent) in 2017, as increases expected for the value of animals/animal products and farm-related income more than offset a predicted decrease in the value of crop production (see detail on value of production in the table on value added). If realized, the forecast 2017 value of crop production ($180.5 billion, the lowest total since 2010) would represent a decline of $8.5 billion (4.5 percent) from 2016.”
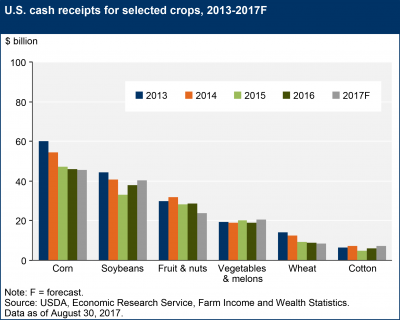
More specifically, the report noted that, “Crop cash receipts—the cash income from crop sales during the 2017 calendar year—are forecast to increase just $0.5 billion (0.3 percent) in 2017 as prices continue to decline for many field crops. Corn receipts are expected to decline for the fifth consecutive year. Expected weakening of calendar-year corn prices more than offsets an expected increase in quantity sold, leading 2017 corn cash receipts to fall by over $0.3 billion (0.7 percent) from 2016…[in addition]…Higher soybean receipts ($2.4 billion or 6.3 percent) in 2017 reflect higher soybean prices and an increase in quantities sold.” (Data on crop cash receipts can be found here).
With respect to livestock, ERS pointed out that, “Total animal/animal product cash receipts are expected to rise $13.6 billion (8.4 percent) in 2017.”
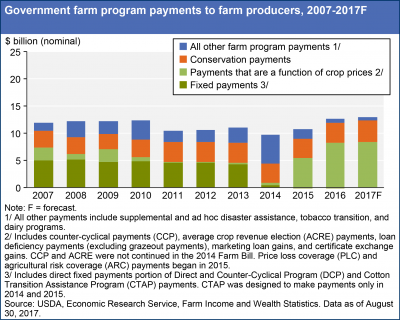
On the issue of federal government financial support, yesterday’s update explained that, “Direct government farm program payments are forecast to decline by 0.2 percent in 2017 from 2016 (see table on government payments). USDA’s Price Loss Coverage (PLC) and Agricultural Risk Coverage (ARC) programs are collectively expected to account for almost 65 percent of all direct government payments in 2017. While PLC payments and conservation program payments are expected to increase in 2017, declines are anticipated for ARC payments and other major programs.
PLC payments are expected to increase almost $1.6 billion while ARC payments are expected to decline about $1.2 billion.
(For additional detail on farm safety-net payments through the first three years of the current Farm Bill, see this Farm Policy News update from earlier this week.)
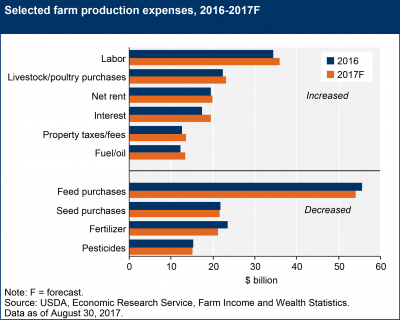
In a closer look at costs of production, ERS stated that, “After reaching record highs exceeding $390 billion in 2014, farm sector production expenses declined by more than $40 billion the next 2 years. Following totals of $359 billion in 2015 and $350 billion in 2016, 2017 production expenses are forecast higher at $355 billion.”
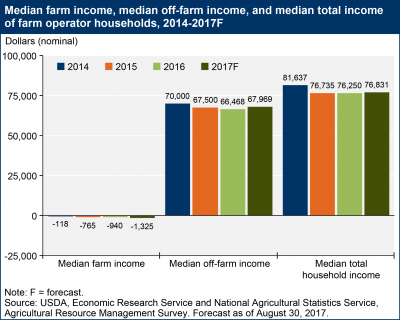
Also yesterday, ERS provided additional detail on farm household income, and indicated that, “Farm households typically receive income from both farm and off-farm sources…[and]…Median farm income earned by farm households in 2016 is estimated to be negative at -$940 and forecast to dip slightly (to -$1,325) in 2017. In recent years, slightly more than half of farm households have lost money on their farming operations each year. Most of these households earn positive off-farm income—and median off-farm income is forecast to increase 2.3 percent next year, from $66,468 in 2016 to $67,969 in 2017.”
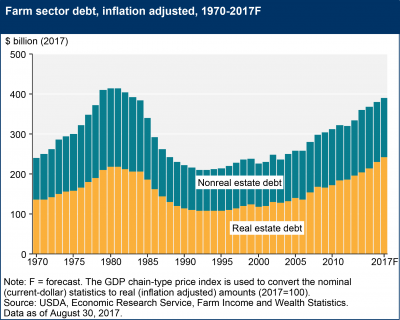
In more detail on farm assets, debt, and wealth, ERS indicated yesterday that, “Farm real estate debt in 2017 is expected to reach an historic high of $242.4 billion. The annual increase ($16.9 billion or 7.5 percent) expected in real estate mortgage loans reflects continued expected demand for cropland combined with anticipated low interest rates, strong balance sheets, and strong crop yields. An additional contributing factor to the increase in farm real estate debt is increasing use of real estate as collateral to secure nonreal estate borrowing.”
Interpreting USDA’s Net Farm Income Forecast
An update last week at the farmdoc daily blog (“Interpreting USDA’s Net Farm Income Forecast“) explained that, “The USDA releases initial net farm income forecasts in February, in conjunction with the USDA’s Outlook Forum, and the forecasts are revised three times based on updated information on agricultural production and prices. The first revision is released in late-summer to reflect updated crop production estimates. The second revision is released in late-fall to reflect updated crop harvest information. A final forecast revision is released in February of the following year when the initial forecast of the next year is released. The USDA releases the official estimates of net farm income the following August, which included more detailed information from farm-level surveys.”
The farmdoc update indicated that, “Figure 1 plots the USDA’s net farm income forecast from 1975 through 2015. The colored dots represent the forecasts and revisions for each year, and the solid line represents the official estimates (released the following August). Figure 1 demonstrates that the majority of the forecasts tend to fall below the official estimates, which suggests that the USDA forecasts tend to under-predict realized net farm income. For example, between 1975 and 2015, the initial forecast released in February under-predicted net farm income estimates by 8.7%, on average.”
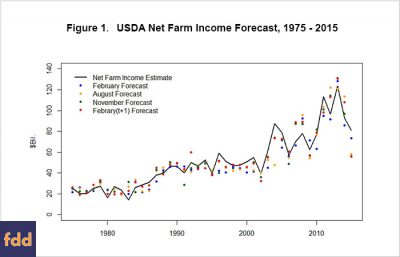
Last week’s farmdoc update added that, “With the additional information collected since the initial forecast, the revised [August] forecast is expected to provide more accurate projection of 2017 net farm income. However, the forecast history suggests that the projections are likely to still be below the official estimates.”


