A package of funding bills assembled by House and Senate appropriators that needs to pass before the end of January does not contain any more aid for farmers. It's also…
USDA Report Examines Farm Household Income Volatility
Last week, USDA’s Economic Research Service (ERS) released a report titled, “Farm Household Income Volatility: An Analysis Using Panel Data From a National Survey.” The report noted that, “There has long been information tracking farm income at the national level, yet little information exists about income variability of individual farm households.” Due to the volatility associated with agricultural production, federal lawmakers have worked to craft policies that minimize farm household income fluctuations. House and Senate Ag Committees in the 115th Congress have already begun the process of continuing this goal as they conduct hearings relating to the next Farm Bill. Today’s update looks at some of the highlights of the ERS report.
Background
The ERS report explained that, “Farm income is highly variable, with earnings subject to wide fluctuations in yields and prices. Farm output can vary unexpectedly because of weather that can damage crops or make it difficult to access fields with equipment at critical planting or harvest times. Plant pests and diseases can be difficult to control and can cause substantial yield reductions. Livestock feed crops are subject to many of the same hazards as food crops. The livestock themselves are also vulnerable to weather and disease risks that can damage herds.”

More specifically with respect to policy goals and income variation, the report stated that, “The 2014 Farm Act significantly shifted Federal agricultural spending toward programs aimed at reducing income risk. The Act ended fixed annual payments to producers based on historical production, and it created new programs tied to annual or multiyear fluctuations in prices, yields, or revenues. The new programs include those that pay producers when prices fall below a reference price or revenue level (Price Loss Coverage (PLC) and Agriculture Risk Coverage (ARC), respectively), and expanded crop insurance programs aimed at providing support for small or ‘shallow’ revenue or yield losses.”
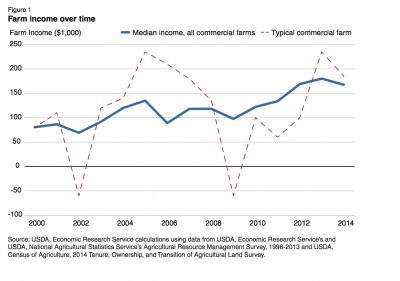
The ERS report noted that, “Figure 1 illustrates the difference between aggregate and individual farm income variability. The blue line shows the median national farm income for a commercial farm household (with at least $350,000 in gross cash farm income, adjusted for inflation) between 1999 and 2014 (from ARMS).”

However, “The median income varies much less than does the income of a typical farm. This is illustrated with the red line, which shows the annual farm income of a hypothetical typical commercial farm. Between 1999 and 2014, the farm has the same average income as the median commercial farm (about $120,000). However, the typical commercial farm’s income varies much more from year to year—the median change between years (positive or negative) is about $86,000.
Because the income of a typical commercial farm varies much more from year to year than does median farm income, the typical farm’s income spans a wider range, and sometimes the household loses money on its farm operation.
Conclusions
After more detailed analysis, the report indicated that, “The data show that farm households have much more volatile total income than do nonfarm households. The median change in total income between years was about eight times larger for the farm households than nonfarm households. Total household income for farmers is highly volatile mainly because farm income varies much more than off-farm income.”
In addition, ERS explained that, “[W]e find that income volatility increases with farm size. Total household income is more volatile on larger farms because operators of larger farms derive a greater share of household income from the farm and because they have more volatile off-farm income.”
With respect to income stability between crop and livestock operations, the report stated that:
Crop farms have, on average, more volatile total household income than livestock farms because crop farms are larger and derive more of their total income from farm sources and also because crop farm income is more volatile than livestock farm income.
“Crop farms also have more volatile farm income, which might be explained by the vulnerability of crops yields to weather and pest risks and the fact that a substantial share of livestock is produced under production and marketing contracts, which reduce income risks for farmers. Consistent with other studies of nonfarm households, we also find that household income is more volatile when the principal operator has less education.”

In addition, the report found that, “An examination of average income volatility over time suggests that farm and total income volatility decreased between 1996 and 2013…[T]he decline in farm income volatility could be explained by a number of factors, including an increased reliance on production contracts, changes in the organization of farm businesses, or an expansion of the Federal crop insurance program.”
And in a closer look at how federal programs have reduced income fluctuations, ERS stated that, “We examined the effect of different types of Government programs on income risk and welfare. We find that all types of program payments (direct, counter-cyclical, conservation, crop insurance, and other) reduce total income volatility (as measured by the coefficient of variation).
Assuming that farmers are moderately risk-averse, we estimated that crop insurance payments provide the greatest benefits per dollar to producers—each net dollar received from crop insurance being worth $1.38 to recipients because of how much the payments reduce total income risk.
“Counter-cyclical payments are also valuable—each dollar of payments being worth $1.10 to farmers.”


